
 Technical analysis is the study of the price movement or price action of a market over time. Traders make use of price charts and various technical indicators that come with those charts to perform their technical analysis.
However, it is my strong belief that traders need only analyze a market’s price action for their technical analysis. Not only is the price action on a chart the purest and cleanest view of that market, but all indicators and other technical analysis studies are based on price action anyways. So, it should go without saying that when we analyze a chart’s price action without added indicators, we are analyzing the most pertinent and clearest view of that market. Anything else is simply a derivative of price action and only works to add unnecessary variables that a trader must make sense out of.
Technical analysis is perhaps the simplest and ‘easiest’ aspect of trading, and likely due to that, it’s very common for traders to over-complicate it by covering their charts in unnecessary indicators. Essentially, all you are doing when you add indicators on top of price action is hiding the main thing you should be analyzing; the price data.
Technical analysis and price action go hand-in-hand
Many professional traders focus on price action as their primary form of technical analysis. They do this because they know that price is the ultimate leading indicator of what price might do next.
How many times have you seen a market move the opposite direction that you expected after a certain economic news release came out? They’re very likely were strong price action clues leading up to that news release of what price was most likely to do. Price often leads the news and foreshadows fundamentals and any news results and fundamentals are reflected in the price action. This is why many traders only use technical analysis and many, including myself, are ‘pure’ technical traders, meaning we primarily use only price action to make our trading decisions.
There are many reasons why price action tends to lead the news and other market fundamentals; big market players like banks and hedge funds who really can move the market have access to information and tools that retail traders like you and I do not. We can read what they are doing in the market by learning to trade based on the price action imprint they leave behind on the charts. We don’t really need to know all the ‘whys’ or ‘how’s’; all we need to know is WHAT they are doing, and we can see that by analyzing the price action.
Price action allows us to find repeatable patterns, place trades, manage risk and profit objectives in a very straight-forward and logical way. By simply making use of support and resistance levels and the natural price data on a chart, we can analyze and trade a market successfully if we know what we are doing.
Here are some famous quotes from legendary traders on technical analysis vs. fundamental analysis:
As Ed Seykota famously said in Jack Schwager’s Market Wizards book:
Fundamentals that you read about are typically useless as the market has already discounted the price, and I call them “funny-mentals.
I am primarily a trend trader with touches of hunches based on about twenty years of experience. In order of importance to me are: (1) the long-term trend, (2) the current chart pattern, and (3) picking a good spot to buy or sell. Those are the three primary component of my trading. Way down in a very distant fourth place are my fundamental ideas and, quite likely, on balance, they have cost me money.
Another Market Wizard, Marty Schwartz, said:
I always laugh at people who say, “I’ve never met a rich technician.” I love that! It’s such an arrogant, nonsensical response. I used fundamentals for nine years and got rich as a technician. – Marty Schwartz
How to use price action for your technical analysis…
Price action analysis teaches a trader how to analyze the market structure; find trends, support and resistance levels and generally learn to ‘read’ the ebbs and flows of a market. There is obviously discretion involved here and I will be the first person to tell you that technical analysis is more of an art than a science. However, it is something you will get more comfortable with and improve at given education, time and practice.
Let’s take a look at some examples of classic technical analysis price action patterns…
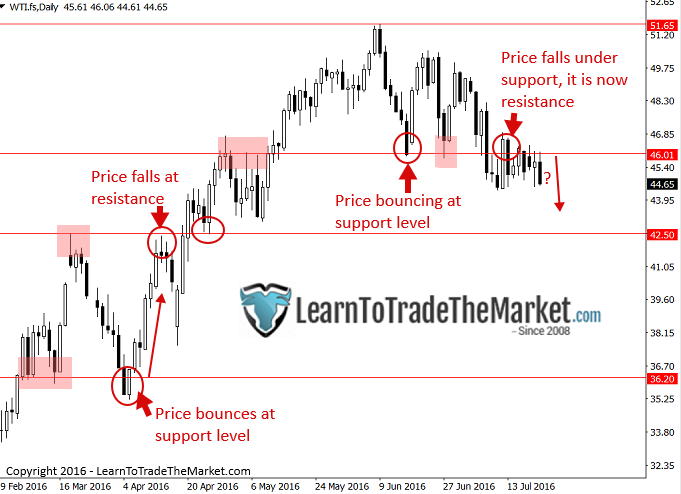
In the chart example below, you will notice how well price is respecting the horizontal support and resistance levels. Learning to draw and trade the key chart levels is a very important skill that any technical analyst needs to learn early-on in their trading career. This is also a core aspect of price action trading as price action is what ‘carves out’ the levels in the market…
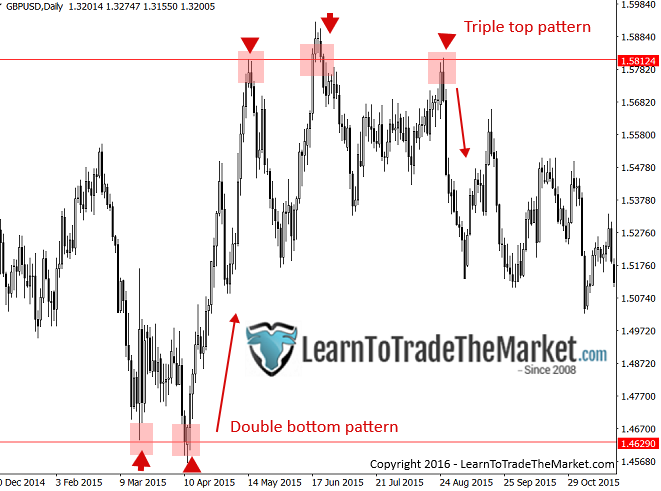
Here we can see the huge moves that often originate from major market tops and bottoms. The chart below is showing a “double bottom”, which is just a general name for price testing a level two times and then bouncing from it. You will then see a “triple top”, a general name for a market that tests a resistance level three times before selling-off. Generally, these patterns are strong indicators of a trend change…
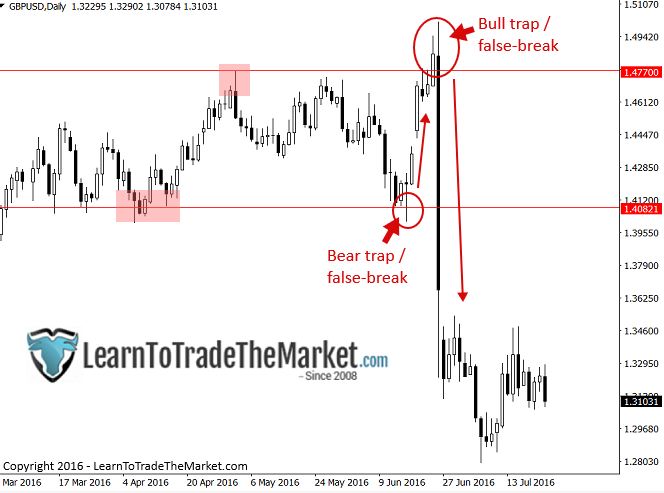
In the chart image below, we can see a couple of false breakout patterns that occurred in the GBPUSD recently. When we get a false-break to the downside that sucks all the bears in before shooting higher, it’s called a ‘bear trap’. When we get a false-break to the upside that sucks all the bulls in before reversing lower, it’s called a ‘bull trap’. Look for these especially in range-bound markets where price is oscillating between key support and resistance levels, as we see below:
When we combine price action signals at key chart levels, as with the pin bar false-break at resistance we see below, or with a strong trend, as with the inside bar pattern we see below, we have a very simple yet high-probability trade method at our disposal:
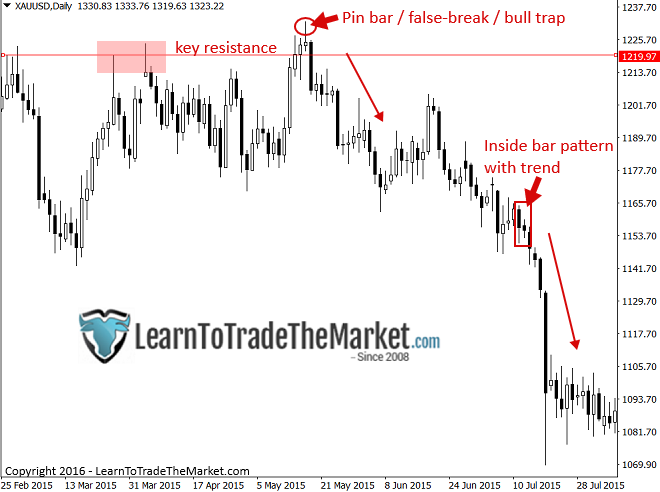
As we can see by the chart examples above, price action is a very simple yet highly effective form of technical analysis. As I like to tell my students, the power lies IN the simplicity. Trading is hard enough as it is, so there is no need to unnecessarily make it even more difficult by plastering tons of confusing indicators all over your charts. We have everything we need in the raw price data of the charts.
Price action analysis allows us to spot high probability trading opportunities, easily define our risk reward and perform our analysis end-of-day. This form of technical analysis frees the mind of clutter and allows us to focus on reading the charts and price action simply by listening to the ‘language’ of the market. Price action is first-hand market data, not looking in the ‘review mirror’ as with most other methods of technical analysis.
Learn To Trade The Market courses are centered around the core philosophies discussed in today’s lesson and focus on the power of technical price action trading. Any serious trader would benefit from undertaking study of these teachings which are the encompassing beliefs of my 16 + years in the market. To learn more, click here.