

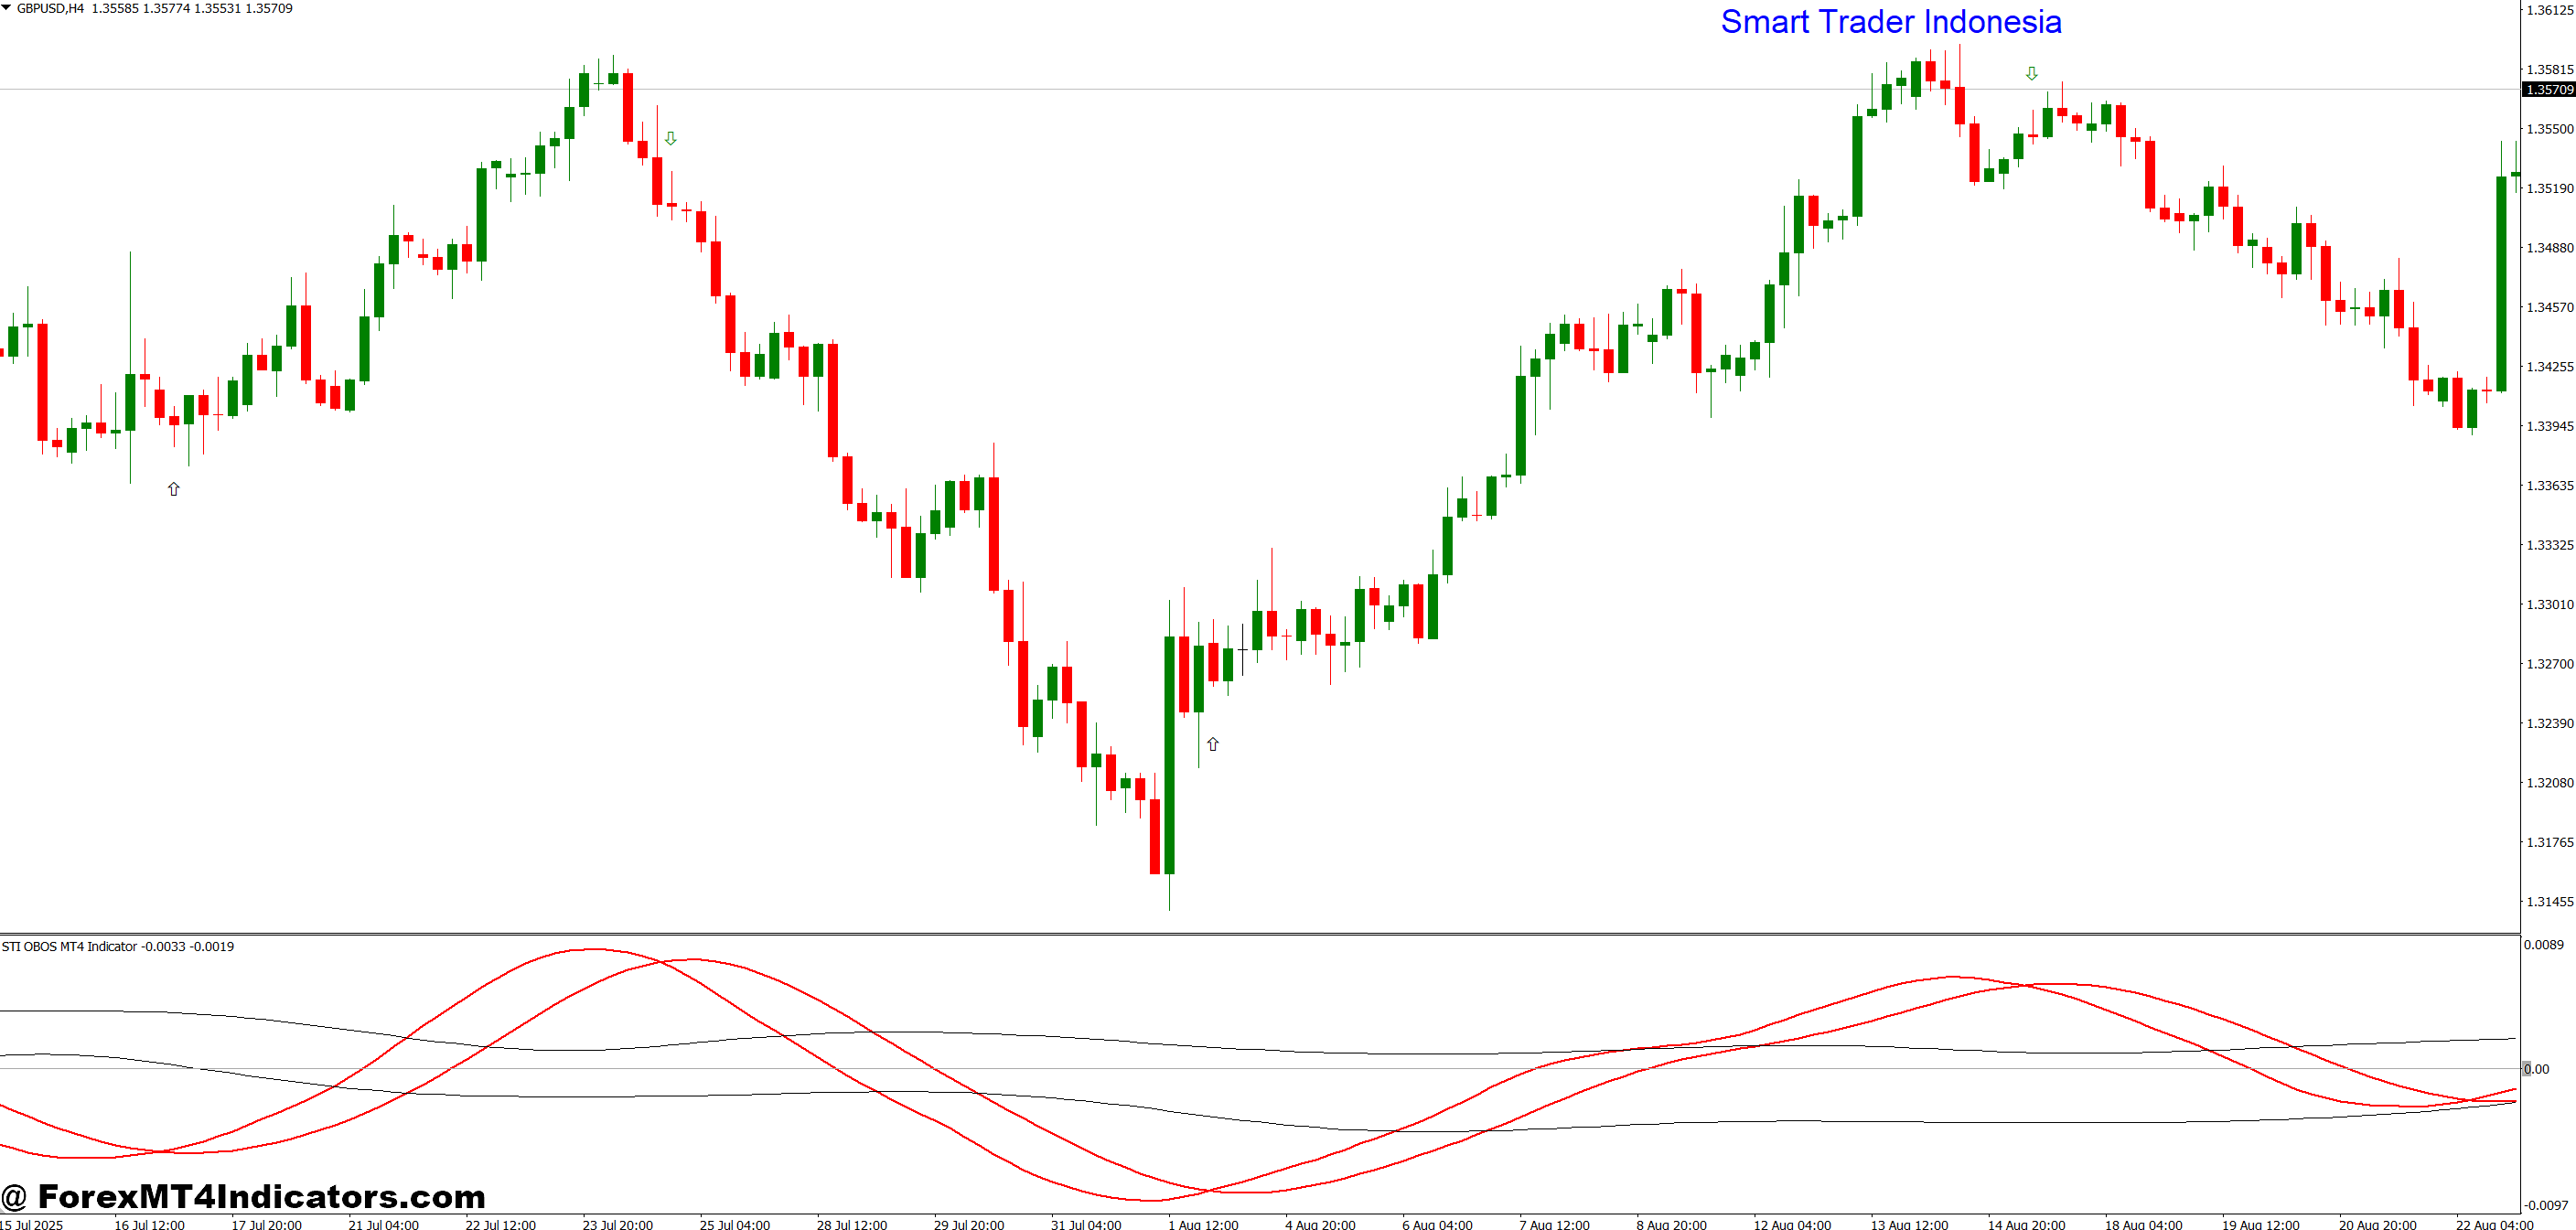
The STI OBOS (Overbought/Oversold) indicator is a momentum-based oscillator built for the MT4 platform. Like RSI or Stochastic, it tracks price relative to a recent range. But the STI version applies a smoothing layer and a trend-bias filter — meaning it doesn’t flag overbought conditions the same way during a strong uptrend as it would in a ranging market.
The core calculation looks at the ratio of recent closes to a defined lookback period, then smooths that reading with a moving average before plotting the signal line. What traders see on the chart is a bounded oscillator, typically ranging from 0 to 100, with overbought above 70 and oversold below 30. That’s familiar territory. The difference is in how the indicator weighs recent price behavior — it responds faster to genuine exhaustion signals and stays quieter during trend continuation.
In practical terms, that means fewer whipsaw signals during EUR/USD trending sessions and sharper reads during London-New York overlap chop.
How to Apply It in Real Trading Scenarios

Here’s the thing — overbought/oversold tools only make sense with context. Slap the STI OBOS on a 1-hour EUR/USD chart during a clean uptrend and every oversold dip becomes a potential buy setup, not a reversal signal. That’s actually how most experienced traders use it.
Trend-following entries: On the EUR/USD 1-hour chart during a defined uptrend, the indicator dipping below 30 and curling back up has historically aligned with pullbacks to structure. A trader testing this on volatile NFP days found that combining the oversold signal with a nearby 50-period EMA gave cleaner entries than using the oscillator alone. Not every signal fired — maybe 60% were usable — but the ones that did set up had better reward-to-risk profiles.
Counter-trend fades: On the GBP/JPY 15-minute chart during ranging Asian sessions, hitting the 70-80 zone consistently flagged short-term reversals back toward the mean. These setups work best when the daily chart shows no strong directional bias. Trying to fade with this tool during a London breakout is where traders get hurt.
Divergence setups: Price makes a higher high while STI OBOS prints a lower high — that’s a classic bearish divergence. On USD/CAD during oil-driven volatility, these divergence signals on the 4-hour chart have preceded 40-60 pip pullbacks with enough frequency to be worth tracking. Still, divergence alone isn’t a trade. It needs a trigger — a candlestick pattern or a break of minor support.
STI OBOS MT4 Indicator Settings and Timeframe Adjustments
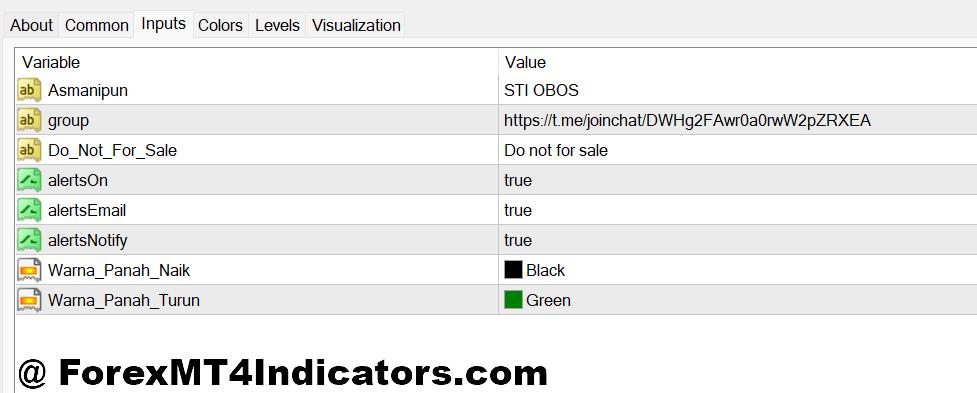
Default settings on most STI OBOS builds use a 14-period lookback with a 3-period signal smoothing. That’s fine for 1-hour and 4-hour charts. For scalpers working the 5-minute chart on EUR/USD or GBP/USD, dropping the period to 9 makes the indicator more responsive — though that comes with more noise. Swing traders on the daily chart can push the period to 21 or even 28 to filter out minor fluctuations and keep focus on meaningful exhaustion zones.
The overbought/oversold threshold is also adjustable. In high-volatility environments — think FOMC days or major economic prints — bumping the overbought threshold to 80 and oversold to 20 keeps traders out of premature counter-trend fades. In quieter markets, the standard 70/30 split does the job.
One practical tip: always backtest any setting change on at least 200-300 candles before using it live. What works on EUR/USD won’t necessarily translate to exotic pairs like USD/ZAR, where liquidity gaps can distort the oscillator reading.
Strengths, Limitations, and How It Compares

The STI OBOS does a few things well. Its smoothing mechanism cuts down on the false signals that plague standard RSI during choppy conditions. It’s also visually clean on MT4 — no clutter, easy to read at a glance. Traders who already understand how to use RSI will adapt to this tool quickly.
That said, it’s not without problems. Like all oscillators, it lags. During strong trending moves, it can stay in overbought territory for an extended period, trapping anyone who tried to fade too early. On the EUR/USD daily chart during Q4 2022’s dollar strength, the indicator read overbought for weeks while price kept running. Traders who respected the trend survived. Those who fought it didn’t.
Compared to standard RSI, STI OBOS tends to be slightly more conservative — it doesn’t fire signals as frequently, which is a feature, not a bug. Against Stochastic, it’s smoother and less reactive to short-term price spikes. Against CCI, it stays bounded (0-100), which some traders find easier to interpret.
No tool eliminates bad trades. The STI OBOS narrows the noise — it doesn’t remove risk.
How to Trade with STI OBOS MT4 Indicator
Buy Entry

- Oversold cross above 30 – Wait for the STI OBOS line to drop below 30 and curl back above it before entering. Dipping below without a confirmed cross is not a signal.
- Bullish divergence confirmation – Price prints a lower low while STI OBOS prints a higher low. Enter on the next bullish candle close, not before.
- 1-hour EUR/USD pullback entry – During an uptrend, wait for STI OBOS to reach the 25-30 zone near a key support level, then buy the bounce with a 15-20 pip stop below structure.
- 4-hour trend alignment – Only take buy signals on lower timeframes if the 4-hour STI OBOS is above 50, confirming overall bullish momentum.
- Signal line rising from below 30 – When the smoothed signal line turns upward from the oversold zone on GBP/USD, target the previous swing high for a 1:2 risk-reward minimum.
- Avoid buying during news events – Don’t enter buy signals 30 minutes before or after high-impact releases like NFP or FOMC. Signals will distort.
- EMA filter confirmation – Only buy when price is trading above the 50-period EMA on the same chart. STI OBOS oversold signals below the EMA fail more often than not.
- Volume spike with oversold reading – A sudden volume increase while STI OBOS sits under 30 adds weight to the reversal case, especially on USD/JPY 1-hour setups.
Sell Entry

- Overbought cross below 70 – Enter short only after STI OBOS peaks above 70 and closes back below it. Sitting above 70 during a strong trend is not a sell signal on its own.
- Bearish divergence setup – Price makes a higher high while STI OBOS makes a lower high. Wait for a confirming bearish candle before pulling the trigger.
- 4-hour GBP/USD fade – When STI OBOS hits the 75-80 range near a daily resistance zone on GBP/USD, consider short entries with a 20-25 pip stop above the recent high.
- Daily chart overbought alignment – Only take sell signals on the 1-hour chart if the daily STI OBOS is above 65, showing higher timeframe exhaustion is building.
- Signal line rolling over from above 70 – Once the smoothed line peaks and turns downward from overbought territory, target the nearest support level for a 1:2 reward setup.
- Skip sell signals in strong uptrends – If price is printing consecutive higher highs and higher lows, overbought readings on STI OBOS will stay elevated. Fading momentum here wrecks accounts.
- 50 EMA rejection confirmation – Sell signals carry more weight when price simultaneously rejects the 50-period EMA from below, combining structure with the oscillator read.
- Avoid sells on thin market sessions – STI OBOS signals during Asian session on EUR/USD are prone to fake-outs. Stick to London or New York overlap for higher-probability short entries.
Putting It All Together
The STI OBOS MT4 indicator earns its place on a chart by doing one thing consistently: filtering overbought and oversold conditions with more nuance than a vanilla RSI. For traders using trend-following strategies, it adds a clean momentum overlay. For range traders, it identifies turning zones without excessive noise. The key is pairing it with market structure — support, resistance, trend direction — rather than trading the signals in isolation.
Traders who’ve used it consistently report that the 1-hour and 4-hour timeframes produce the most reliable setups on major pairs like EUR/USD, GBP/USD, and USD/JPY. Start with those before experimenting with exotic pairs or shorter timeframes.
And the honest reality: this tool won’t save a poorly constructed trading plan. Used as part of a complete system — with defined risk parameters, position sizing, and stop placement — it becomes genuinely useful.
Recommended MT4/MT5 Broker
XM Broker
- Free $50 To Start Trading Instantly! (Withdraw-able Profit)
- Deposit Bonus up to $5,000
- Unlimited Loyalty Program
- Award Winning Forex Broker
- Additional Exclusive Bonuses Throughout The Year
- Exclusive 90% VIP Cash Rebates for all Trades!

>> Sign Up for XM Broker Account here with Exclusive 90% VIP Cash Rebates For All Future Trades [Use This Special Invitation Link] <<
Already an XM client but missing out on cashback? Open New Real Account and Enter this Partner Code: VIP90
(Free MT4 Indicators Download)


Enter Your Email Address below, download link will be sent to you.
Get Download Link