

BTC is under pressure.
After repeated rejections from the $80K to $83K region, price has now broken lower and is testing below $78K, right around the monthly open. At the same time, institutional demand is weakening, ETF flows have flipped negative, and macro conditions are shifting risk-off.
When structure starts to shift, professional traders no longer ask whether this is a dip, but whether the market is beginning to build value lower.
That’s what Volume Profile reveals.
Building on the Volume Profile Visible Range indicator that we explained last month, this month we explore Volume Profile Fixed Range, which is a more precise way to see where value is forming inside the current move.
Because when you understand where value is building, you’re no longer guessing, you start mastering the game.
Quick refresher: What is Volume Profile?
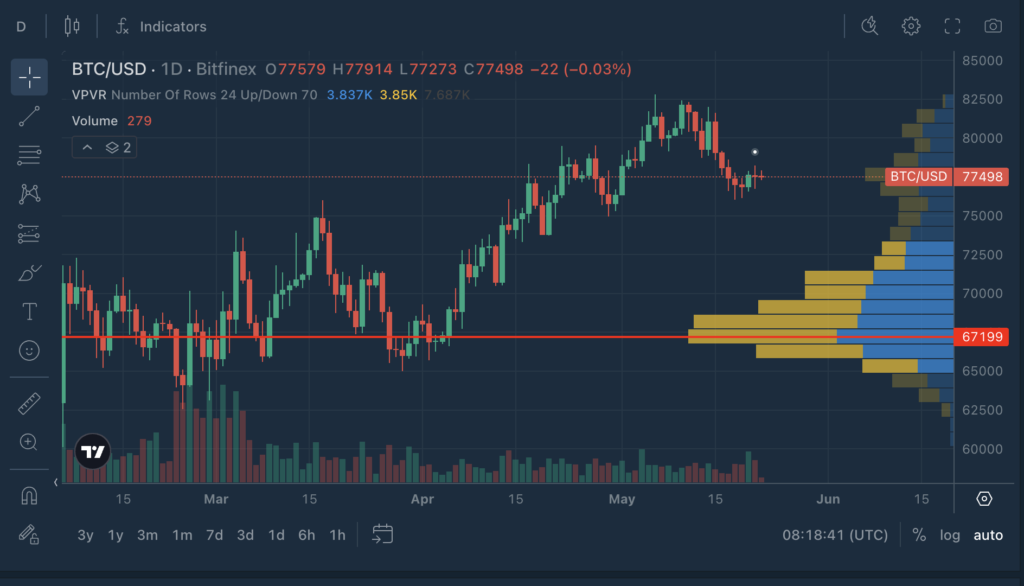
Volume Profile shows how much trading happened at each price level.
Instead of looking at volume over time, it shows you where the market actually did the most trading. That shift in perspective is important. Because price alone tells you where the market moved. Volume Profile tells you the price levels where it mattered.
Each horizontal bar is split into two colours: Yellow = buying volume. Blue = selling volume
That’s how you start to see:
- where the market agreed on value
- where buyers and sellers were most active
- where price is more likely to slow down or react
At the centre of it all is the Point of Control (POC), the level with the highest traded volume. This is often the market’s centre of gravity, a level price tends to revisit because that’s where the most agreement took place.
Around the POC sits the Value Area, the range where the majority of trading occurred. Think of it as the zone where the market feels most comfortable. When price is inside it, the market is balanced. When price moves away from it, the market is either exploring or repricing.
Volume Profile Visible Range vs Volume Profile Fixed Range
There are two ways to use Volume Profile, and each answers a different question.
Volume Profile Visible Range shows you where the market built value across your entire screen. It gives you context. You see the bigger picture, where price has spent the most time and where the key levels are.
Volume Profile Fixed Range zooms in. It lets you isolate a specific move and see exactly where value was built within that move.
Visible Range is context. Fixed Range is precision. Used together, they tell you not just where value was, but where it is shifting.
How to use Volume Profile Fixed Range
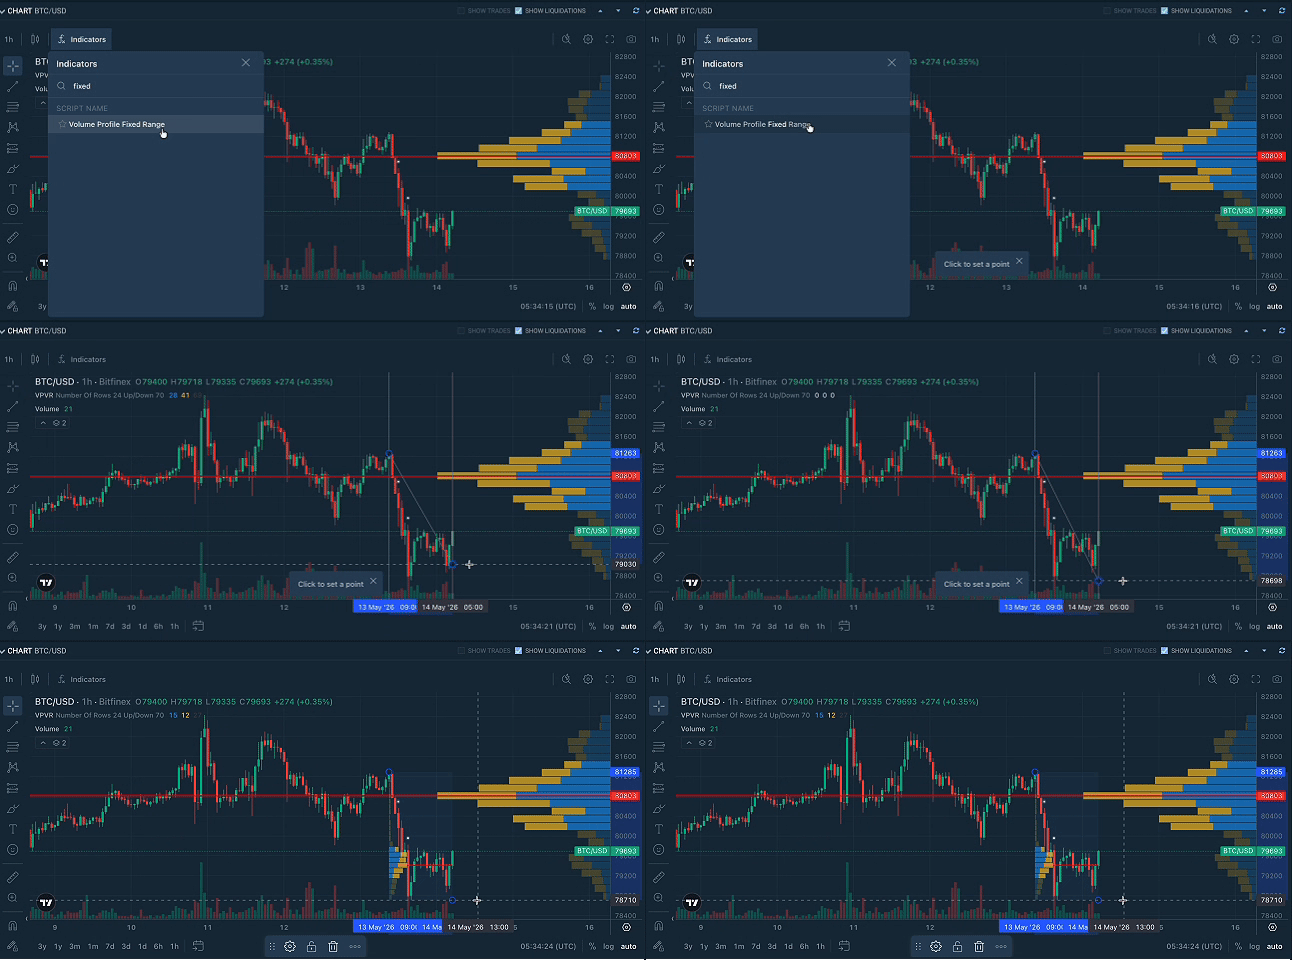
The key with Fixed Range is not to draw it everywhere. It only works when you anchor it to the move that actually matters.
Start by identifying a clear shift in the market:
- a rejection from a key level
- a breakdown or breakout
- a change in structure, like lower highs forming or support giving way
Once you’ve identified that move, draw your Fixed Range from:
- where the move began
- to where it ended or started to stabilise
Example in Action
Let’s look at BTC/USD on the 1-hour chart with VPVR loaded up on May 19th, 2026.
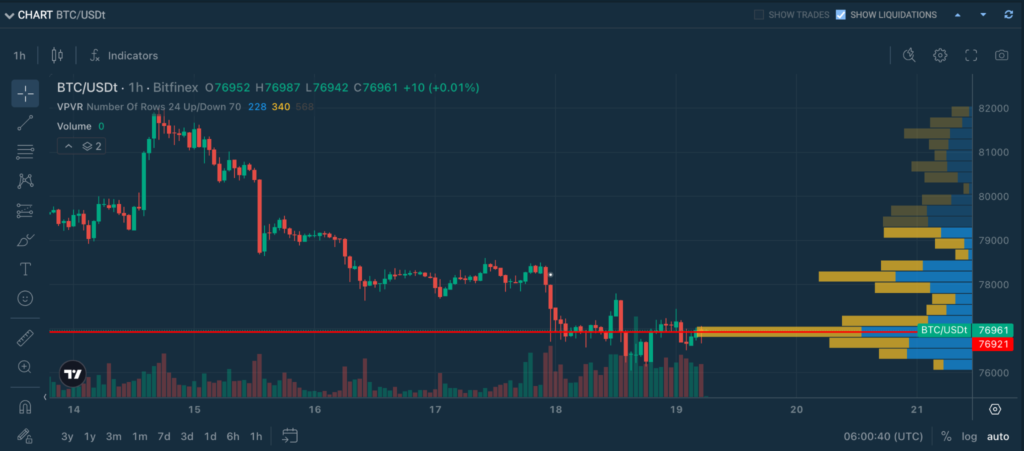
Price broke down aggressively after being rejected at $82K, losing support and entering quickly into the ~$76–77K zone. The move was sharp and one-sided, with little resistance on the way down. Since then, price has stabilised and is now consolidating around ~$77K, showing early signs of acceptance at lower levels rather than an immediate reversal.
- Volume Profile: A large high-volume node (HVN) is now forming around ~$76.8–77.2K, marking the area where the market is starting to build new trading activity after the breakdown.
- POC (~$77K): Sits within this zone, acting as the new centre of gravity where price is repeatedly trading and finding short-term balance.
- Above current price: A high volume node at ~$78–79K, reflecting the prior value area where the breakdown originated. This zone now acts as overhead resistance.
- Below current price: Volume is thinner, indicating that the move down into ~$76K happened quickly, with limited structure built beneath.
Volume Profile shows that the market is no longer holding its previous value around ~$78–79K. Instead, it is beginning to establish a new value area lower, around ~$77K. The strong clustering at current levels suggests acceptance, while the heavier volume above signals supply that price has yet to reclaim.
This means that price is now trading within newly formed value, not returning to prior acceptance.
For intraday traders using the 1-hour chart, if price holds above the ~$77K POC, it suggests continued consolidation and potential rotation higher toward ~$78–79K. If price fails to hold this level, it reinforces the idea that the breakdown is still in play, with the market likely to continue building value lower.
Now let’s add Volume Profile Fixed Range
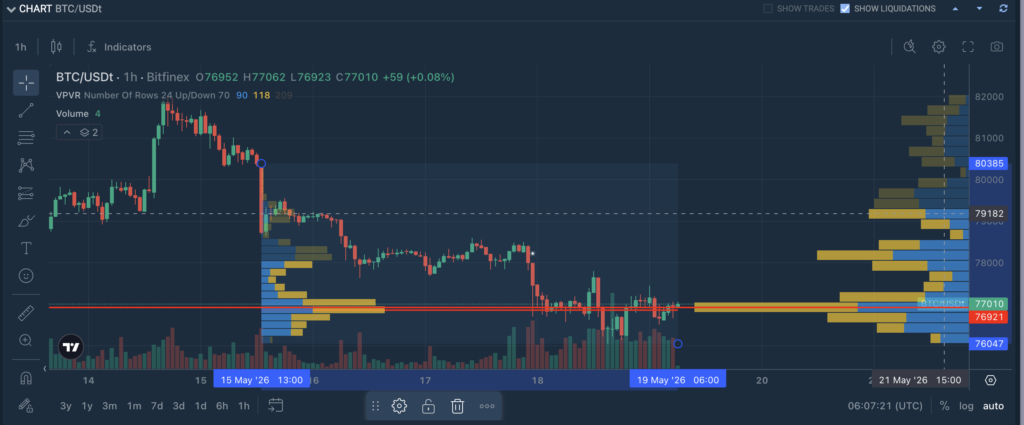
To get a clearer read on what’s actually controlling price right now, we isolate the most recent move.
In this case, we draw Volume Profile Fixed Range from the last major rejection area (~$80.3K) to the recent low (~$76k)
Why this section?
Because this is the move that shifted market structure. It’s where price was rejected from prior value, buyers lost control, and the market broke down into a lower trading range. If we want to understand what’s happening now, this is the move that matters.
- Fixed Range POC (~$77K):
Sits at the same level as the broader Visible Range POC, marking a shared centre of gravity. - Within this range:
Volume clusters tightly around the ~$77K region, showing where the market has stabilised after the breakdown and is now building acceptance. - Above this range:
Volume remains heavier into the ~$78–80K region, reflecting prior activity and the area price has yet to reclaim.
This is the key shift: the market has already established a new value area around ~$77K.
The fact that the Fixed Range POC and Visible Range POC align at the same level tells us: this new value is being accepted across both the most recent move and the broader structure.
Rather than being in transition, the market is currently in equilibrium at a lower level.

Bonus Read: 4H Timeframe Context
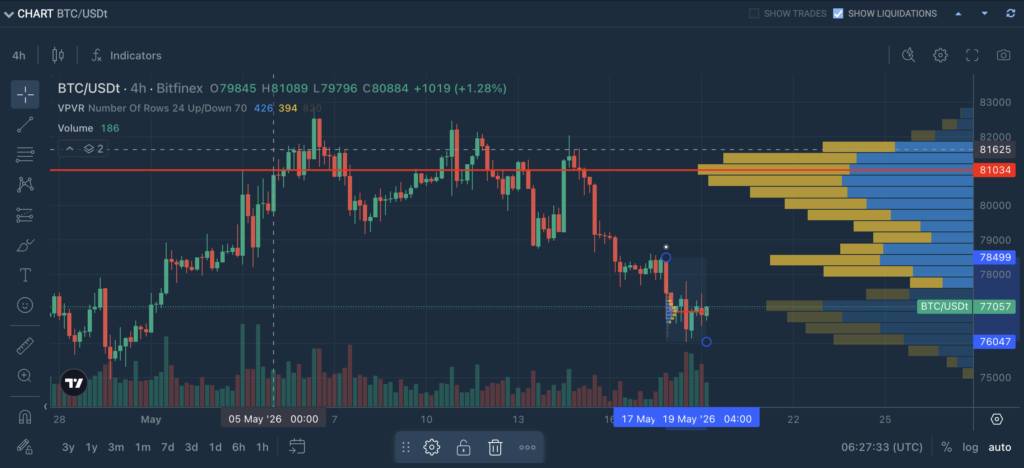
Zooming out to the 4-hour chart adds perspective.
Price pushed into the ~$81–82K region multiple times before reversing sharply and breaking lower, trading down into the ~$76–77K zone.
Volume Profile:
- Visible Range (broader context):
A large high-volume node (HVN) sits around ~$80–81K, marking the area where the market previously built the most trading activity. - Fixed Range POC (~$77K):
Sits well below the prior value area, accumulating volume and marks the centre of gravity for the most recent move.
This shows that the market has moved away from its previous equilibrium and is now accepting lower prices. Price is not just pulling back. It has repriced and stabilised at a lower level.
- Above current price (~$79–81K):
Heavy volume from prior value, now acting as resistance - At current price (~$77K):
New acceptance zone, where the market is balancing - Below (~$75–76K):
Thinner volume, meaning a break lower could move quickly
Holding around ~$77K keeps the market balanced within this new value area. Unless buyers can push price back above ~$79–81K and hold it, the structure stays weak. That means price is more likely to continue lower, especially since there’s not much volume support below ~$75–76K.
Try it on Bitfinex
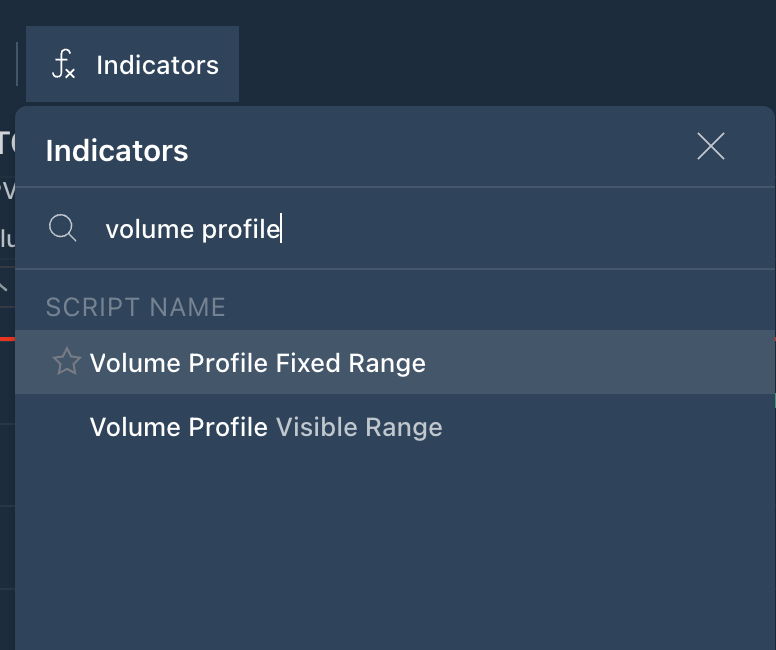
- Open any trading pair
- Add “Volume Profile Visible Range”
- Then apply “Volume Profile Fixed Range” to isolate a move
- Leverage Bitfinex’s zero trading fees to implement your strategies with zero trading costs
Bitfinex. Master Your Universe.

Explore the full Chart Decoder library: