

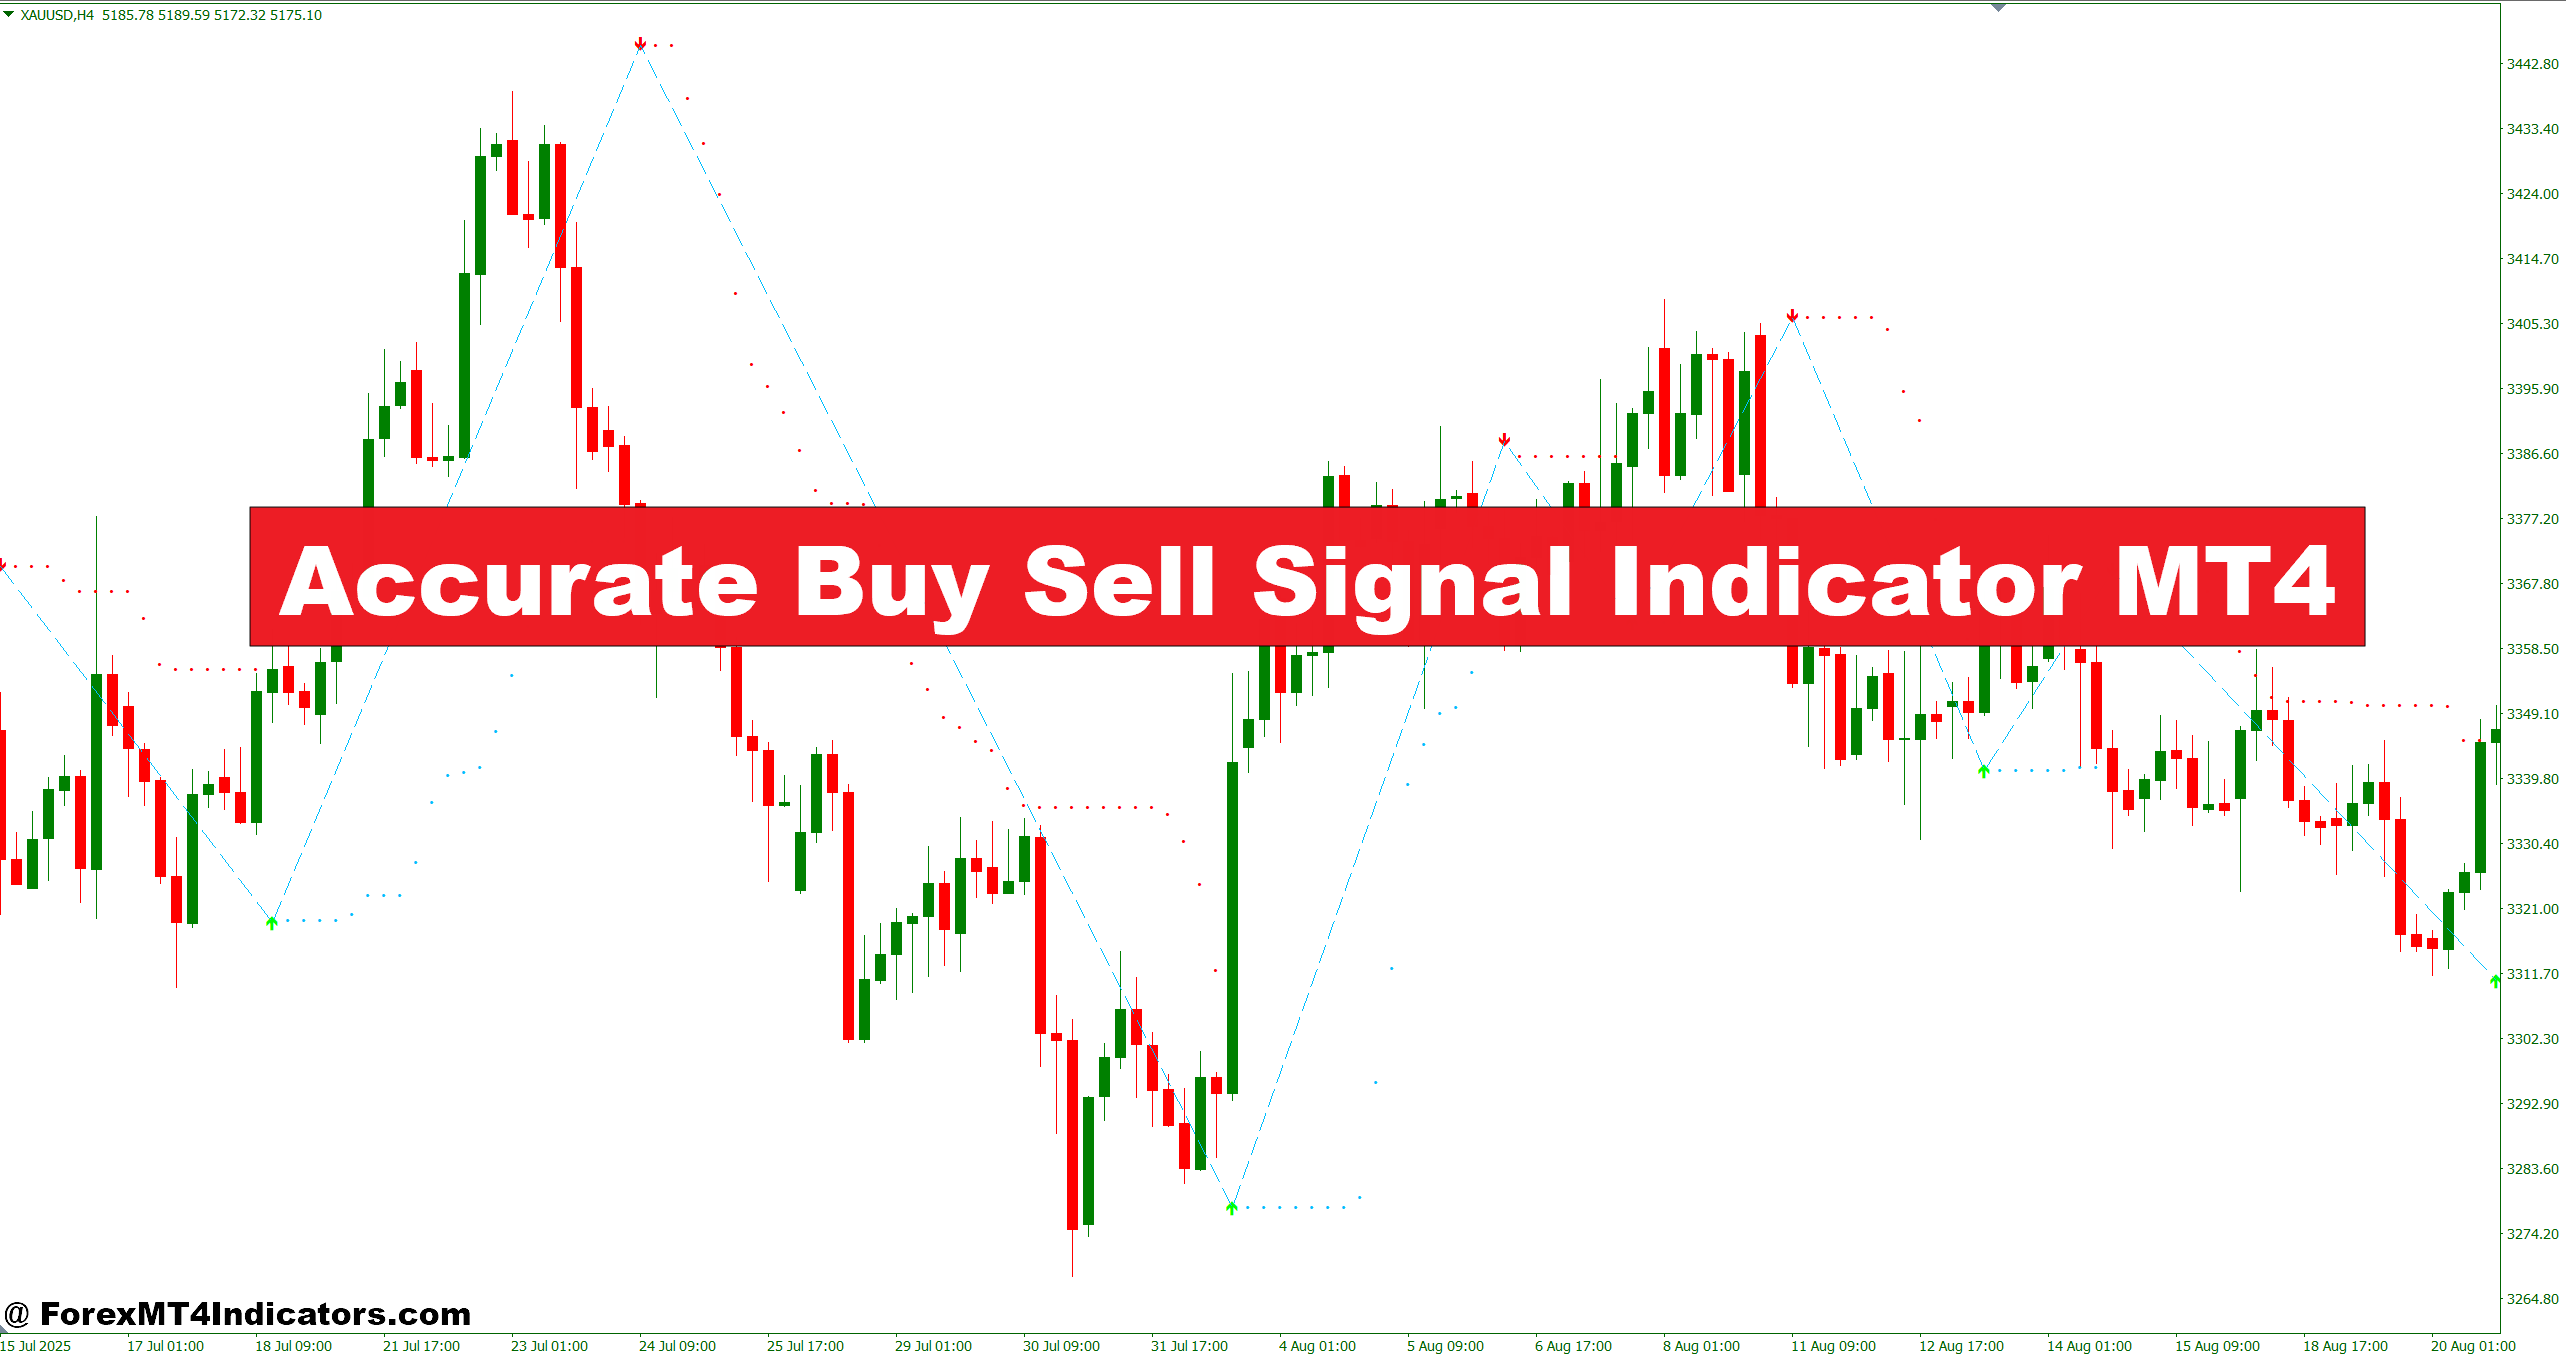
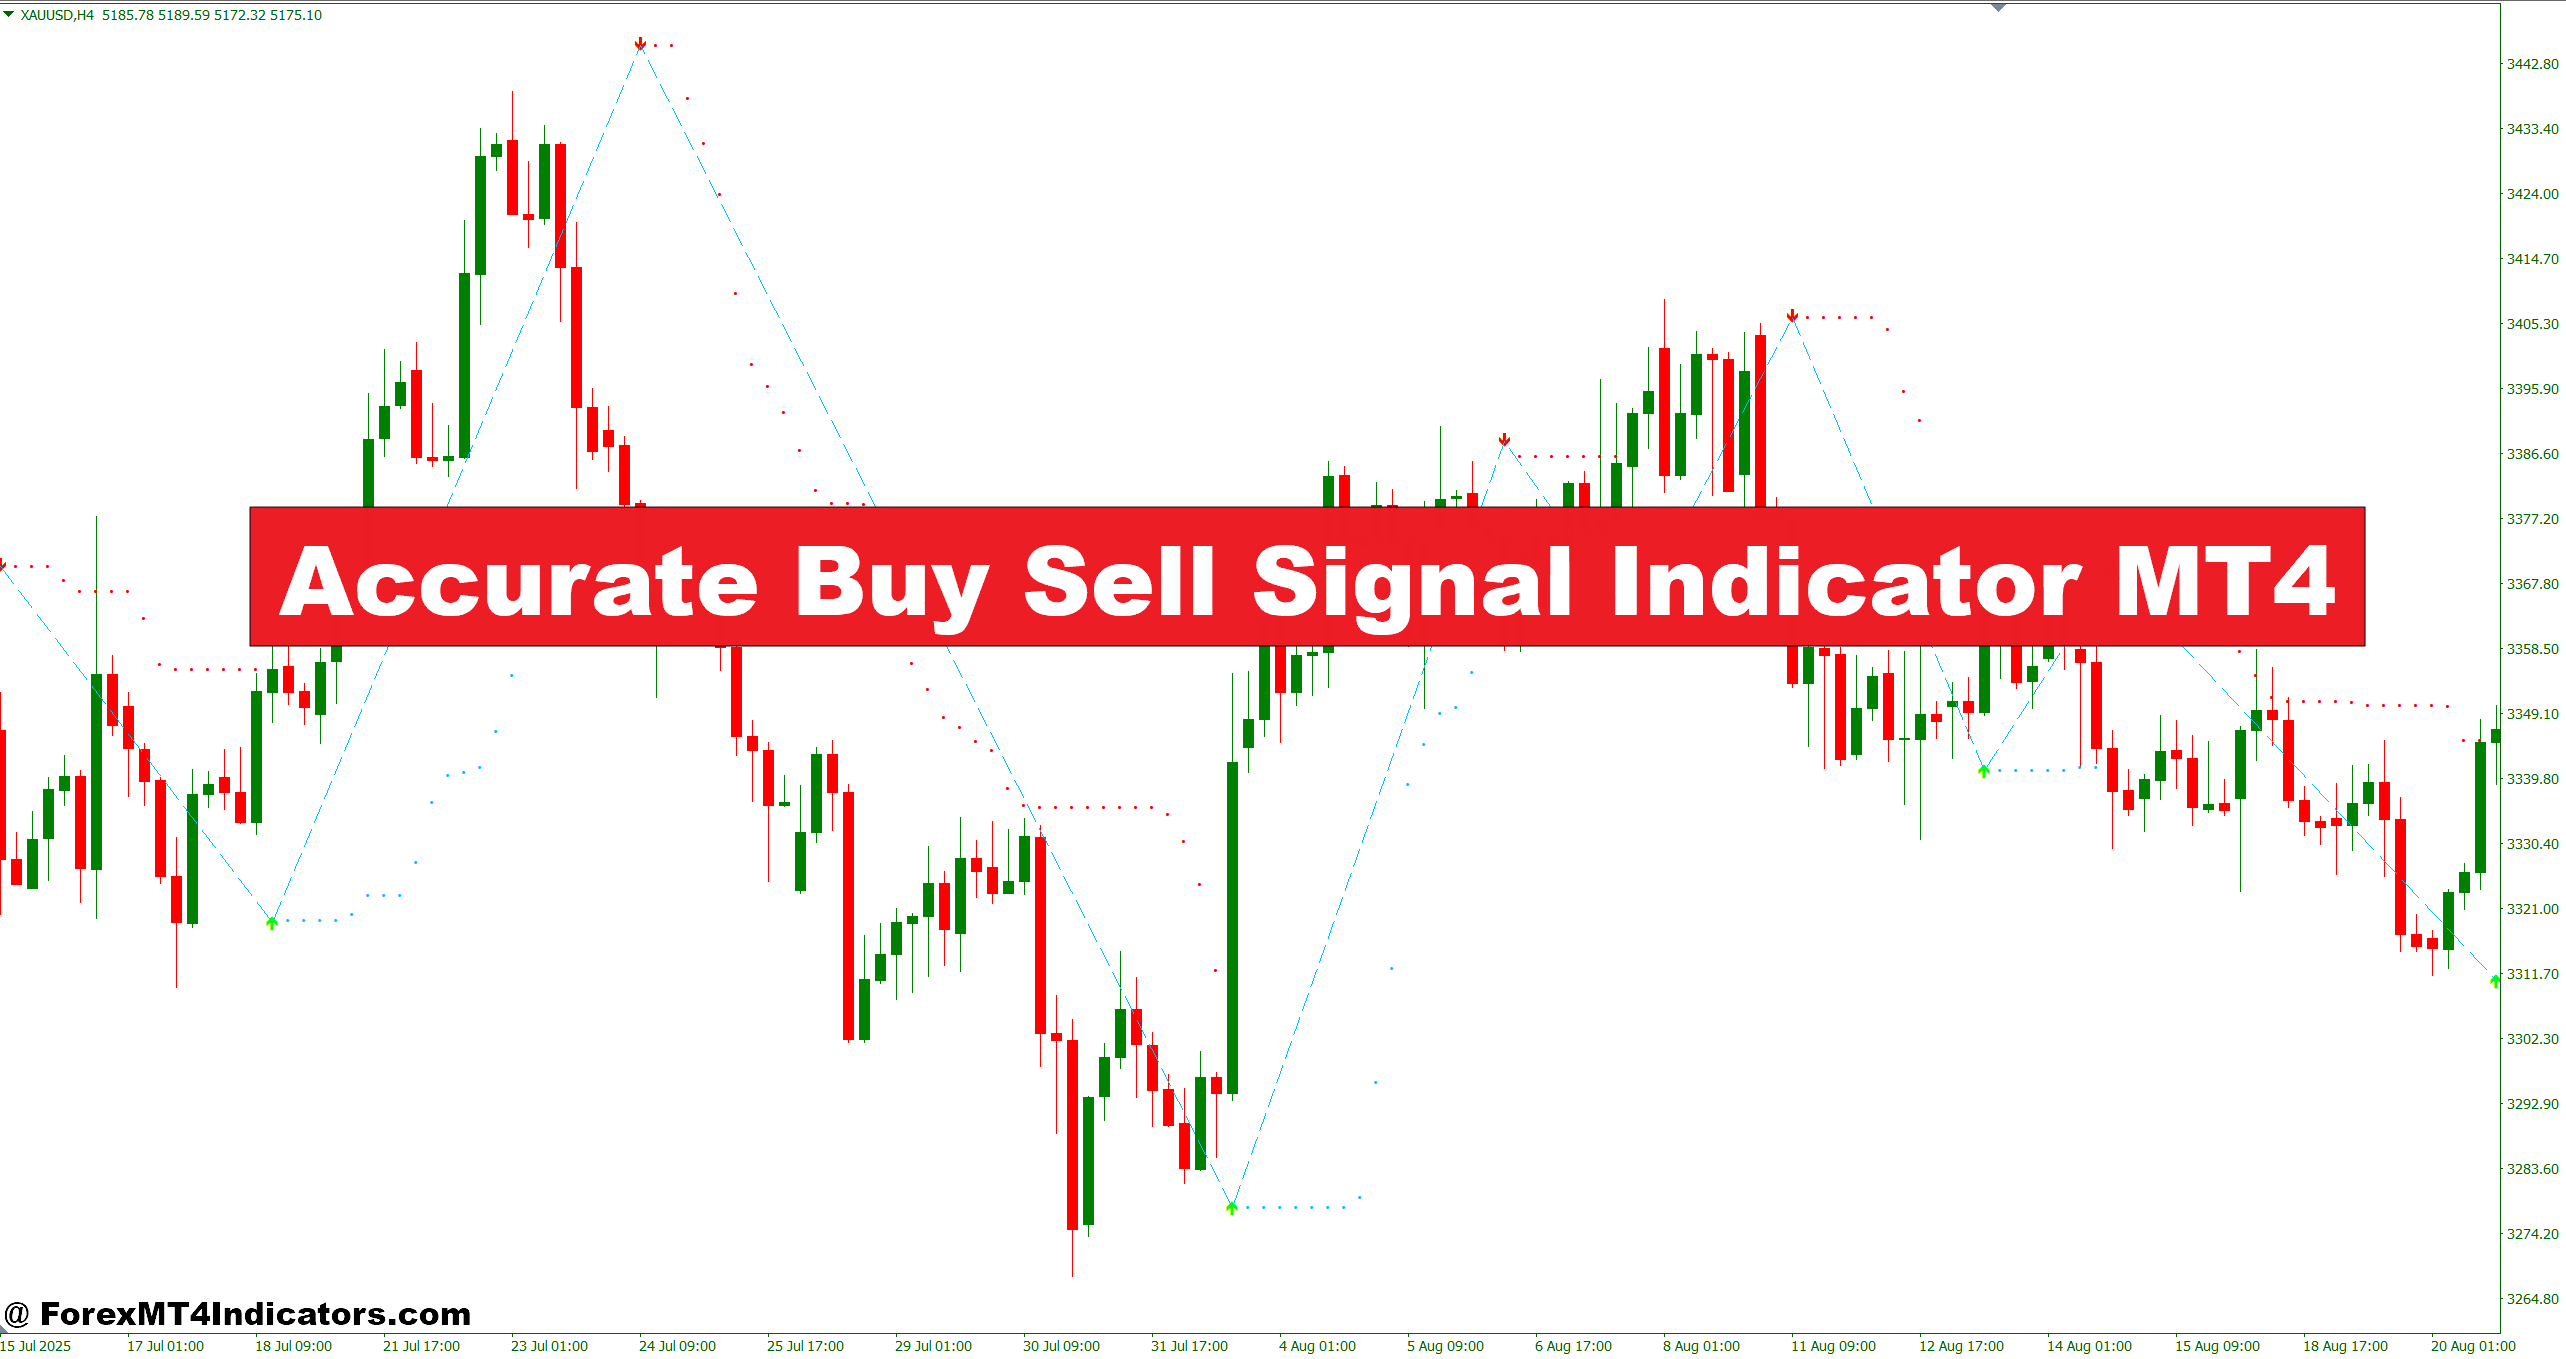
The accurate buy sell signal indicator for MT4 promises to fix that. It marks entry points directly on the chart — arrows or labels showing exactly where to buy or sell. No interpretation needed. But does it deliver? Here’s an honest look at how this tool works, where it adds real value, and where traders need to stay cautious.
How the Accurate Buy Sell Signal Indicator Actually Works
The indicator doesn’t use a single calculation. Most versions combine two or three underlying components — typically a trend filter (like a moving average crossover or ADX), a momentum oscillator (often a smoothed RSI or CCI derivative), and sometimes a volatility filter to suppress signals during low-momentum chop.
When all conditions align — trend direction confirmed, momentum crossing a threshold, volatility above a minimum level — the indicator paints a buy or sell arrow on the candle.
What makes this different from a basic moving average crossover is the layered confirmation. A single MA cross generates signals constantly, many of them false. Adding momentum and volatility filters narrows the output significantly. On a EUR/USD 1-hour chart during a trending London session, this approach can cut false signals by a noticeable margin compared to raw MA crossovers.
That said, the signals repaint on some versions. Always test this before trading live. Apply the indicator, wait for a signal arrow to appear on the current candle, then let the candle close. If the arrow disappears or shifts after close, that version repaints — and historical results are completely misleading.
Applying It to Real Trades

Take a practical setup: EUR/USD, 4-hour chart, during a clear uptrend following a period of consolidation. The indicator fires a buy signal after a pullback to a prior support level. Price has been making higher highs and higher lows. The signal aligns with the trend direction and appears at a logical structure point. That’s a valid scenario to consider an entry.
Compare that to using the same indicator on a ranging GBP/JPY market during the Asian session. It generates signals frequently. But price oscillates between the same levels, and most signals end up stopped out before any meaningful move develops.
This is the core lesson experienced traders learn fast: the indicator works best with the broader market context, not instead of it. Using it in isolation, without considering what’s happening at higher timeframes or whether price is trending or ranging, leads to frustration.
When testing this on volatile NFP days, signals become unreliable. Spreads widen, price spikes in both directions, and the algorithm’s filters can’t keep up with the speed of movement. Sitting out major news events with this tool is the smarter play.
Accurate Buy Sell Signal Indicator MT4 Settings and Customization

Most MT4 versions of this indicator offer a few adjustable parameters:
Signal sensitivity controls how many signals appear. A lower sensitivity setting means fewer arrows but higher quality setups. A higher setting generates more signals — useful for scalpers on the 5-minute chart, but cluttered on longer timeframes.
Trend period adjusts the lookback for the trend filter. For swing trading on the daily chart, extending this to 50 or 100 periods smooths out noise. For day trading on the 15-minute chart, a 14 or 20 period setting responds faster.
Alert settings — most versions include pop-up, email, or push notifications. Enabling these means traders don’t need to watch the screen constantly.
A practical starting point: 1-hour EUR/USD with default settings. Run it on historical data first. Count winning versus losing signals over 50-100 examples before putting any capital behind it.
Honest Advantages and Real Limitations
The main advantage is clarity. Instead of interpreting multiple indicators separately, the buy/sell signal does the combining automatically. For traders who struggle with information overload, that’s genuinely useful.
Backtesting results often look impressive. But backtesting with a repainting indicator is worthless. And even non-repainting versions show better historical performance than live trading delivers — that’s just the nature of curve-fitted parameters meeting real market randomness.
Compared to a standard MACD crossover, this indicator typically signals earlier and filters some of the noise during trending conditions. Against a pure RSI overbought/oversold strategy, it performs better in trending markets but similarly poorly in sideways conditions.
The limitation traders run into most: the indicator doesn’t know about support and resistance, supply and demand zones, or major news events. It reads price mathematically. Combining it with basic horizontal levels and a simple higher-timeframe trend check adds meaningful context that the indicator alone can’t provide.
How to Trade with Accurate Buy Sell Signal Indicator MT4
Buy Entry

- Blue arrow confirmation – Wait for the buy arrow to fully form on a closed candle before entering; never jump in mid-candle on EUR/USD or GBP/USD.
- Trend alignment check – Only take buy signals when price sits above the 50 EMA on the 1-hour or 4-hour chart; trading against the trend turns good signals into losers fast.
- Support zone confluence – Enter when the buy arrow appears within 10-15 pips of a known support level; signals floating in open space carry far less weight.
- Stop loss placement – Set stop 5-10 pips below the signal candle’s low; anything tighter gets hunted on pairs like GBP/USD during London open volatility.
- Avoid news candles – Skip buy signals that form 30 minutes before or after high-impact news; the arrow means nothing when spreads spike to 20+ pips.
- Volume or momentum confirmation – Look for a strong bullish close on the signal candle, not a doji or spinning top; weak candles produce weak follow-through.
- Target setting – Aim for the next resistance level or a fixed 1:2 risk-reward minimum; don’t exit at the first 10-pip move on a 4-hour signal.
Sell Entry

- Red arrow confirmation – Enter only after the sell arrow locks in on a closed candle; a forming arrow on GBP/USD can vanish before close and cost real money.
- Downtrend filter – Take sell signals only when price trades below the 50 EMA on your chosen timeframe; selling into an uptrend fights the dominant flow.
- Resistance zone confluence – Best sell setups appear within 10-15 pips of overhead resistance; signals in mid-range chop hit stop losses more often than targets.
- Stop loss placement – Place stop 5-10 pips above the signal candle’s high; give price room to breathe without letting a bad trade run 40 pips against you.
- Skip ranging markets – If EUR/USD has moved less than 30 pips in the last 4 hours, the sell signal is likely a fake-out; flat markets generate noise, not trends.
- Momentum check – The signal candle should close near its low with decent body size; a small-body candle near resistance signals hesitation, not conviction.
- Daily bias confirmation – Check the daily chart first; taking a 1-hour sell signal against a strong daily uptrend is a low-probability trade regardless of how clean the arrow looks.
Final Thoughts
The accurate buy sell signal indicator for MT4 is a legitimate tool when used correctly. It simplifies entry timing, reduces some of the noise common to raw oscillator signals, and works reasonably well during trending market phases on currency pairs like EUR/USD or GBP/USD.
But it’s not a shortcut. Traders who apply it without understanding market structure, without checking for repainting, and without basic risk management rules will likely lose money — not because the indicator is useless, but because no single tool compensates for poor process.
Test it on a demo account. Run it through at least 50 historical setups on the pairs and timeframes you trade. Track the results honestly. That process alone will reveal more than any description of the tool can.
Recommended MT4/MT5 Broker
XM Broker
- Free $50 To Start Trading Instantly! (Withdraw-able Profit)
- Deposit Bonus up to $5,000
- Unlimited Loyalty Program
- Award Winning Forex Broker
- Additional Exclusive Bonuses Throughout The Year
- Exclusive 90% VIP Cash Rebates for all Trades!

>> Sign Up for XM Broker Account here with Exclusive 90% VIP Cash Rebates For All Future Trades [Use This Special Invitation Link] <<
Already an XM client but missing out on cashback? Open New Real Account and Enter this Partner Code: VIP90
