

Bitcoin is showing renewed signs of on-chain capitulation, according to Axel Adler Jr.’s latest Adler AM Bitcoin Morning Brief, as realized capitalization contracts and loss-taking sales dominate market activity. The setup matters because two independent measures: Realized Cap Net Position 30D Change and adjusted SOPR are now pointing to the same stress regime.
In the June 10 brief, Adler said Bitcoin’s Realized Cap has declined by roughly $12 billion from its mid-May peak, falling from about $1.087 trillion to $1.075 trillion. The 30-day percentage change in Realized Cap has dropped to -1.1%, marking the first time since mid-March that capital outflows have reached that level.
“Capital is leaving the Bitcoin network, and participant behavior confirms a capitulation regime – sales are being made at a loss,” Adler wrote. “This brief examines how close the current stress is to the March extremes and what needs to happen for the regime to change.”
Bitcoin Realized Cap Outflows Accelerate
Realized Cap measures the aggregate value of Bitcoin based on the price at which each coin last moved, making it a useful proxy for whether capital is entering or leaving the network. In Adler’s framework, the recent move is not just a mild deterioration. The pace of contraction has accelerated sharply.
Related Reading
As recently as June 1, the Realized Cap Net Position 30D Change stood at -0.15%. By June 8, it had fallen to -1.1%. Over the same period, Bitcoin’s price dropped from $82,000 to $63,000, a 23% decline.
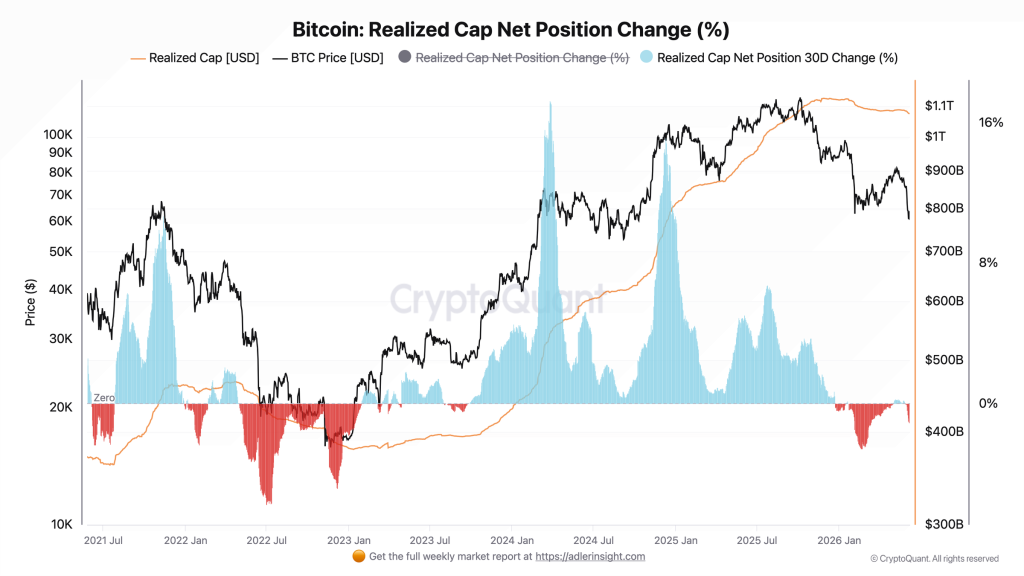
Adler compared the current setup with the March capitulation phase, when the same Realized Cap measure fell as low as -2.4%. That leaves room for further stress if outflows continue to deepen, though the current reading is already severe enough to place the market back into a pronounced negative regime.
“The current pace of outflows is already comparable to the beginning of the March capitulation, when the indicator reached -2.4%,” the brief noted. “That means there is still room for further deterioration. The first positive signal would be stabilization in the 30D Change near zero, followed by a turn upward.”
Loss-Taking Sales Confirm The Stress
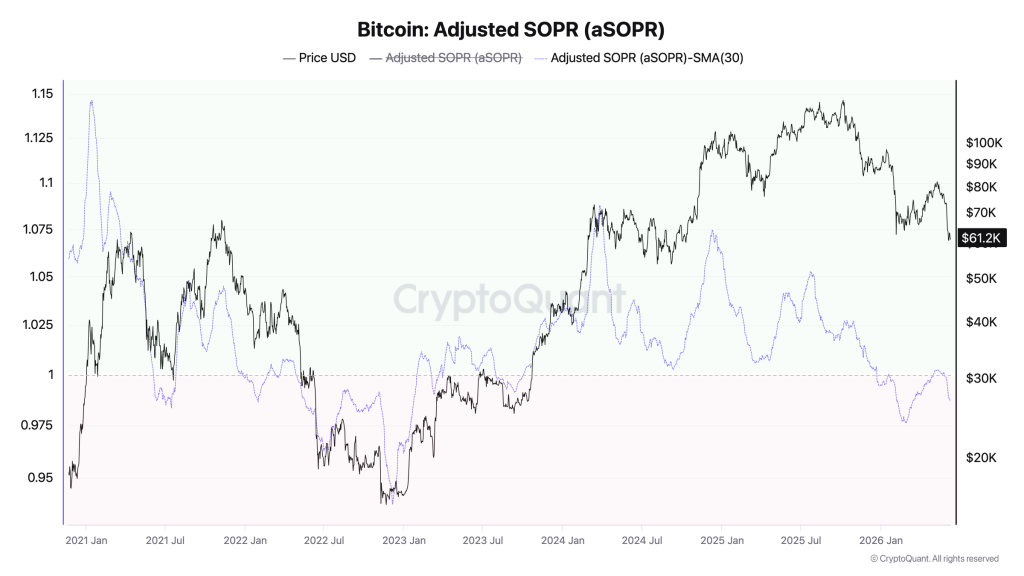
The second major signal comes from adjusted SOPR, or aSOPR, which tracks whether coins moved on-chain are being sold at a profit or a loss. A reading above 1 indicates profit-taking. A reading below 1 indicates loss realization.
According to Adler, Bitcoin’s aSOPR SMA-30 broke below the critical 1.0 threshold on May 28 and has remained below it for 13 consecutive days. The current reading of 0.987 implies that, on average, each coin moved is being sold at a loss of about 1.3%.
Related Reading
That makes the current decline more than a price correction in Adler’s reading. The structure of selling has shifted. Market participants are not merely distributing gains; they are realizing losses into weakness.
“A prolonged period with aSOPR below 1 is a classic marker of weak hands being flushed out,” Adler wrote. “Until aSOPR turns upward and begins to retest 1.0, sellers remain in control.”
The significance lies in the alignment between both indicators. Realized Cap shows the macro-level capital drain, while aSOPR explains the internal mechanics of that drain. In Adler’s words, “Both charts describe the same process from different angles. Realized Cap captures the macro picture – capital is leaving the network. aSOPR shows the internal mechanics of that move – the outflow is being driven not by profit-taking, but by forced selling at a loss.”
Adler’s brief identifies a clear condition for a regime change: aSOPR needs to reverse upward and reclaim 1.0, while Realized Cap outflows need to stabilize and move back toward zero. Without those two signals, the market remains in what he describes as a capitulationary regime.
The risk is that the current outflow cycle intensifies toward the March extreme near -2.4%. Such a move would imply a second wave of capitulation and could keep pressure on Bitcoin’s price.
At press time, BTC traded at $61,828.

Featured image created with DALL.E, chart from TradingView.com