

Key Takeaways
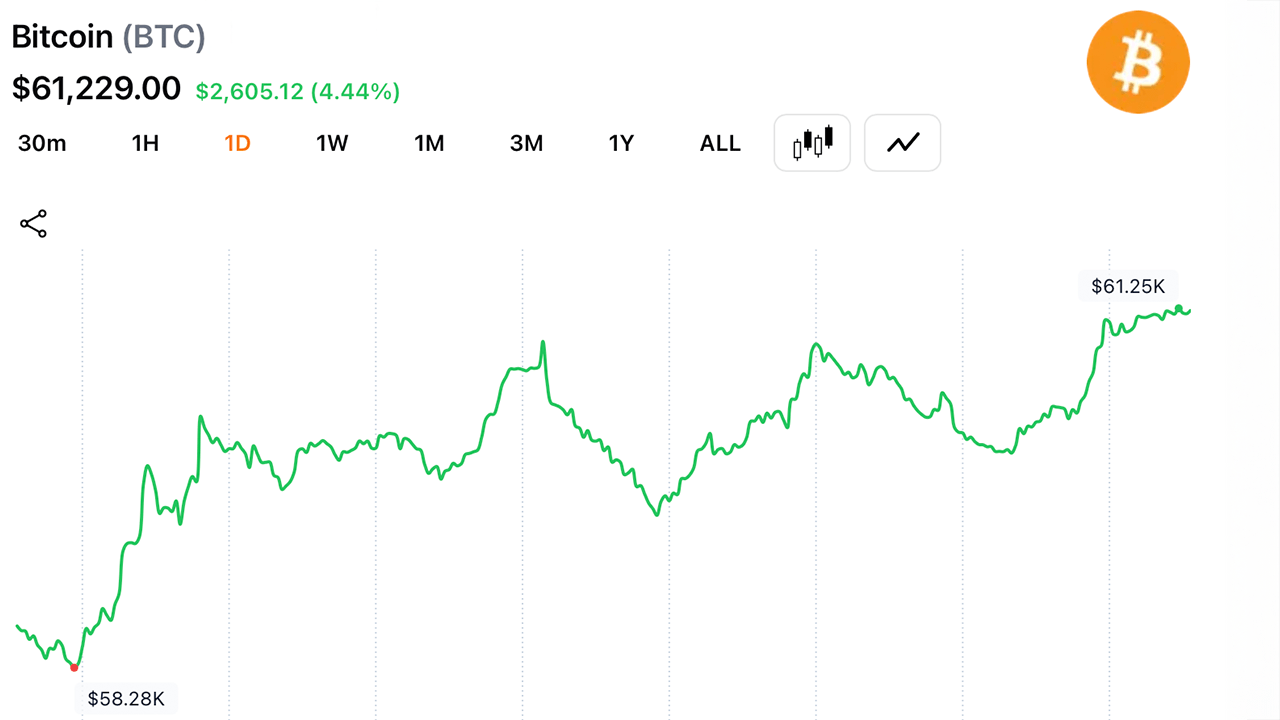
- Bitcoin traded at $61,211 Thursday, up over 5% from its $57,735 low.
- MACD and momentum turned bullish while nine of twelve moving averages stayed bearish.
- Traders are watching the $61,500 to $62,000 zone, where 20-period averages could decide the next move.
Bitcoin Fights Back After the June Selloff
The bounce follows a pullback that traders have been calling the June selloff, with bitcoin recovering off a low near $57,735 and pushing back toward the $61,000 mark. Trading volume over the past 24 hours reached $44.052 billion, and bitcoin’s market capitalization stood at $1.227 trillion.
The recovery has been steady rather than sharp, with buyers stepping in at each dip rather than forcing a single violent move higher.
Daily Chart Shows a Higher Low Taking Shape
The daily chart shows bitcoin forming a higher low off the $57.7k area, a signal that buyers stepped in before price could revisit June’s floor. Support sits at $59.5k to $60k, then $57.7k below that.
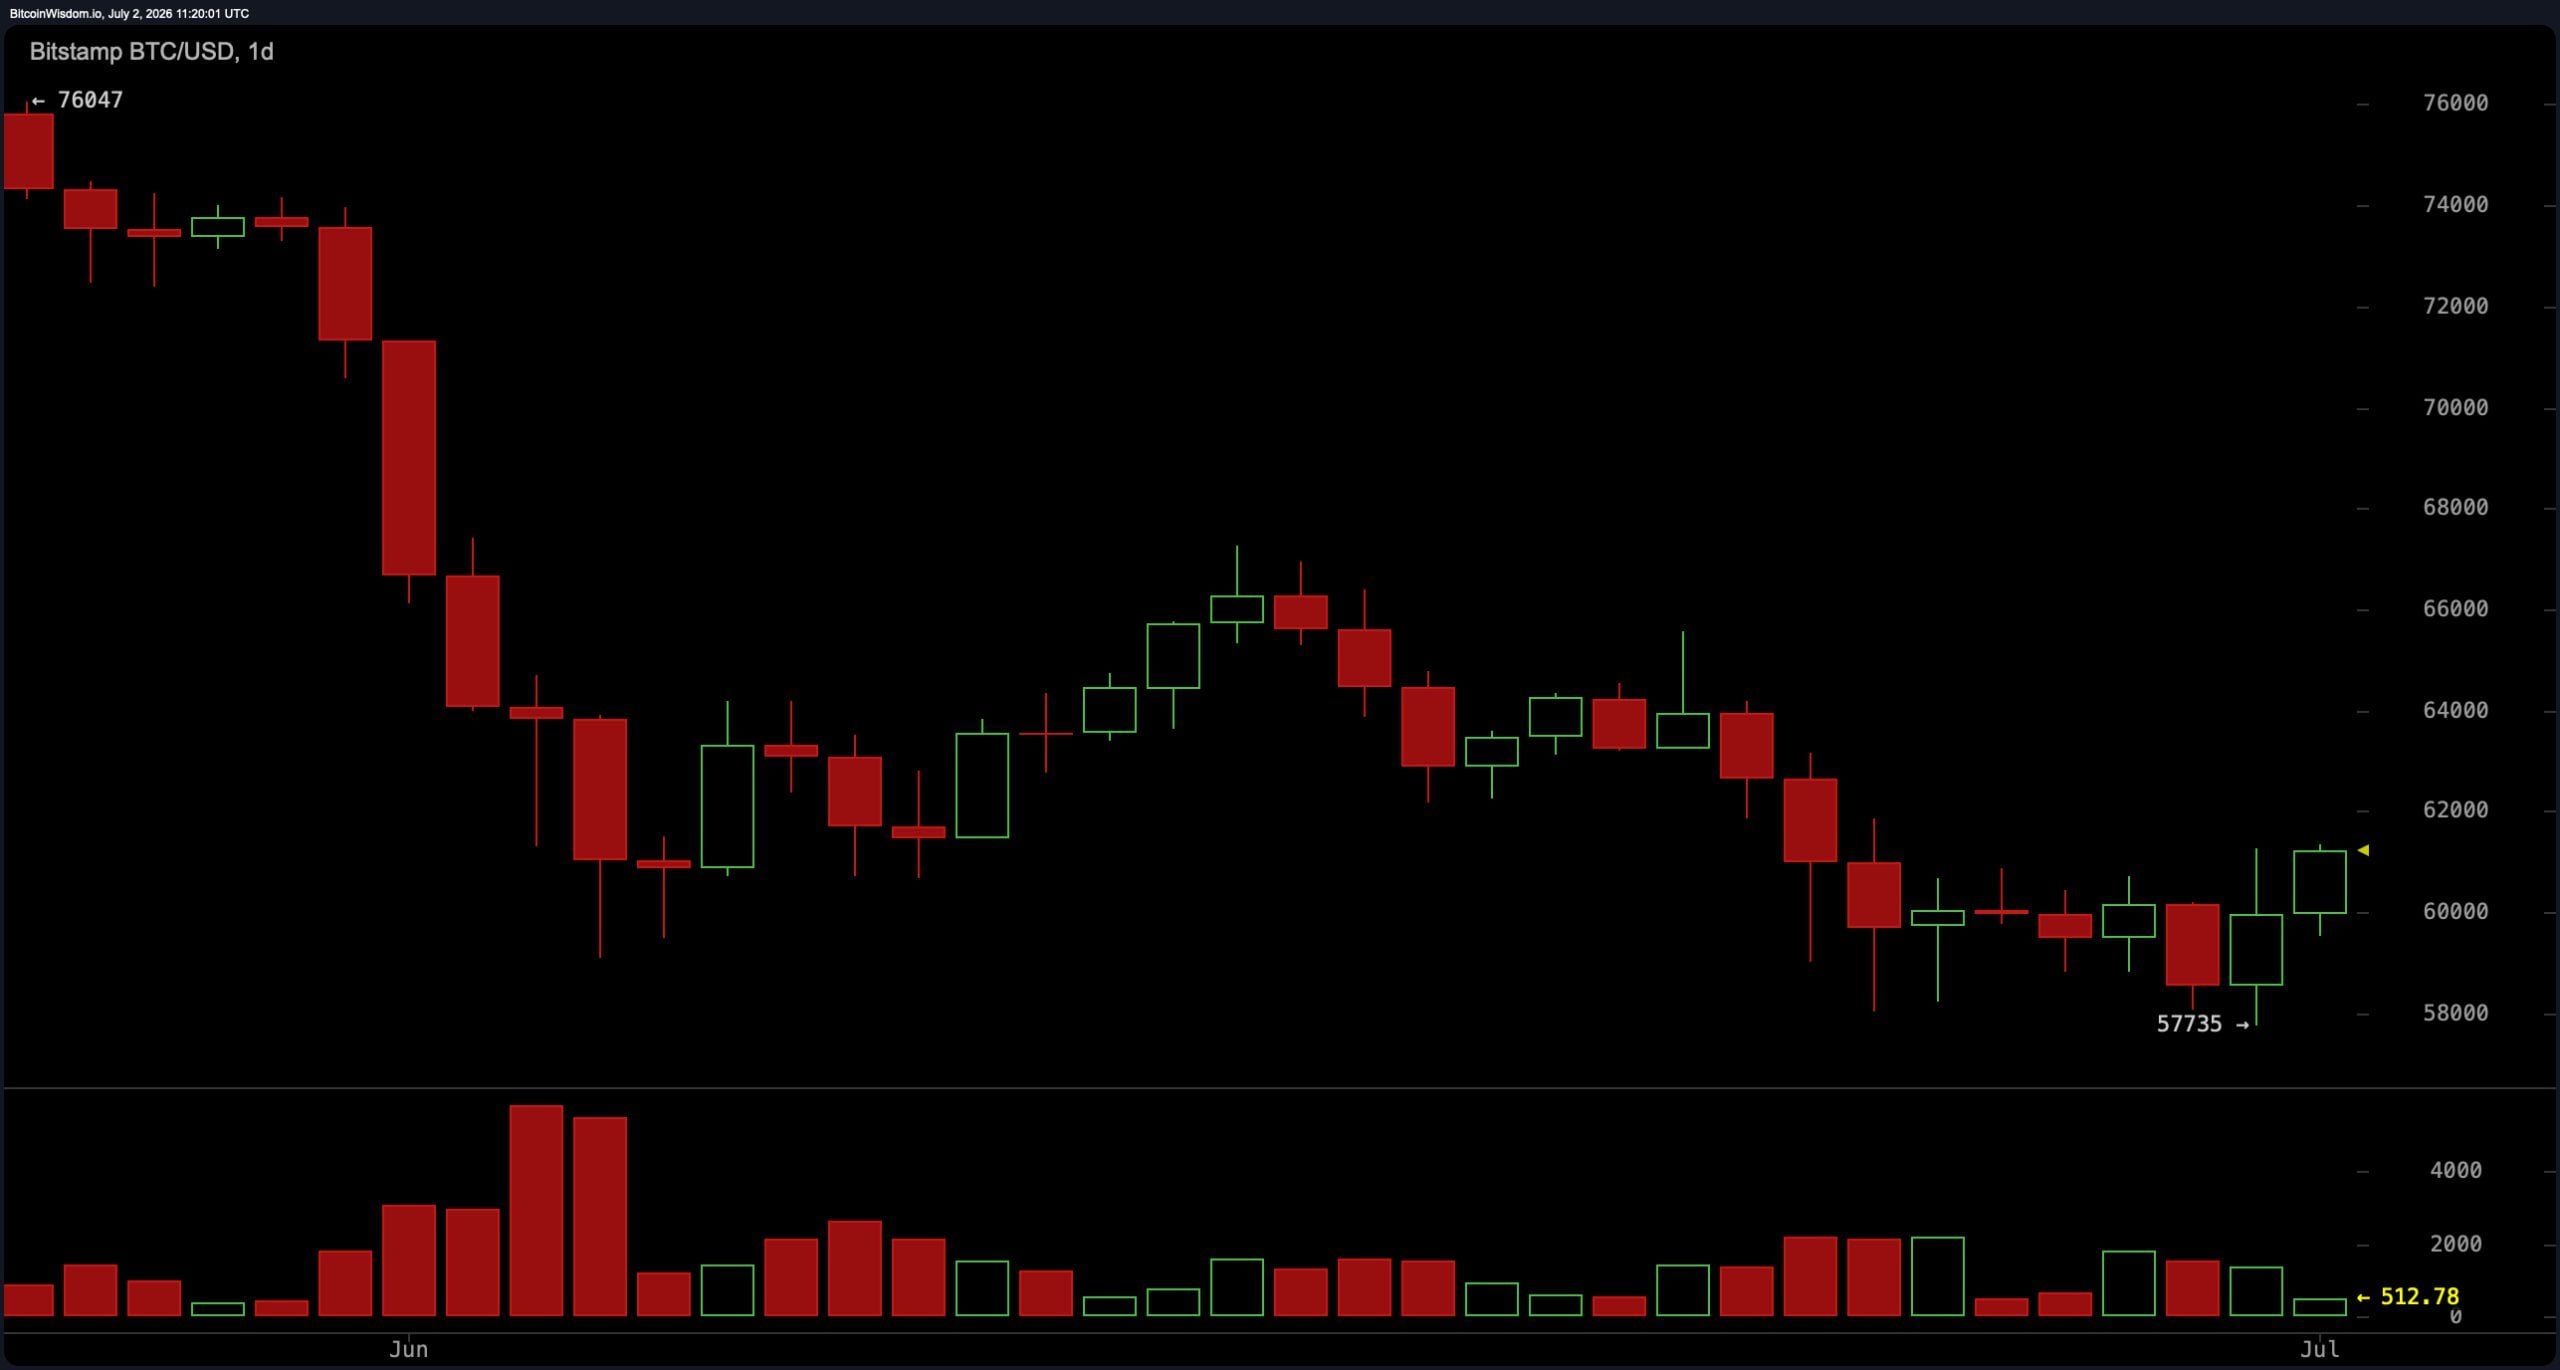
Resistance runs from $61.3k to $62k, with a second wall at $64k. Recent daily candles have closed green, suggesting buyers are regaining ground, though the broader daily trend has not fully reversed. A daily close above $61.3k to $62k would strengthen the case for a continued move higher.
Four-Hour Chart Shows the Strongest Structure of the Three
The 4-hour chart carries the most bullish structure among the three timeframes tracked. Price has built a run of higher highs and higher lows since bouncing off $57.7k, and the latest candles are pressing directly into resistance near $61.3k.
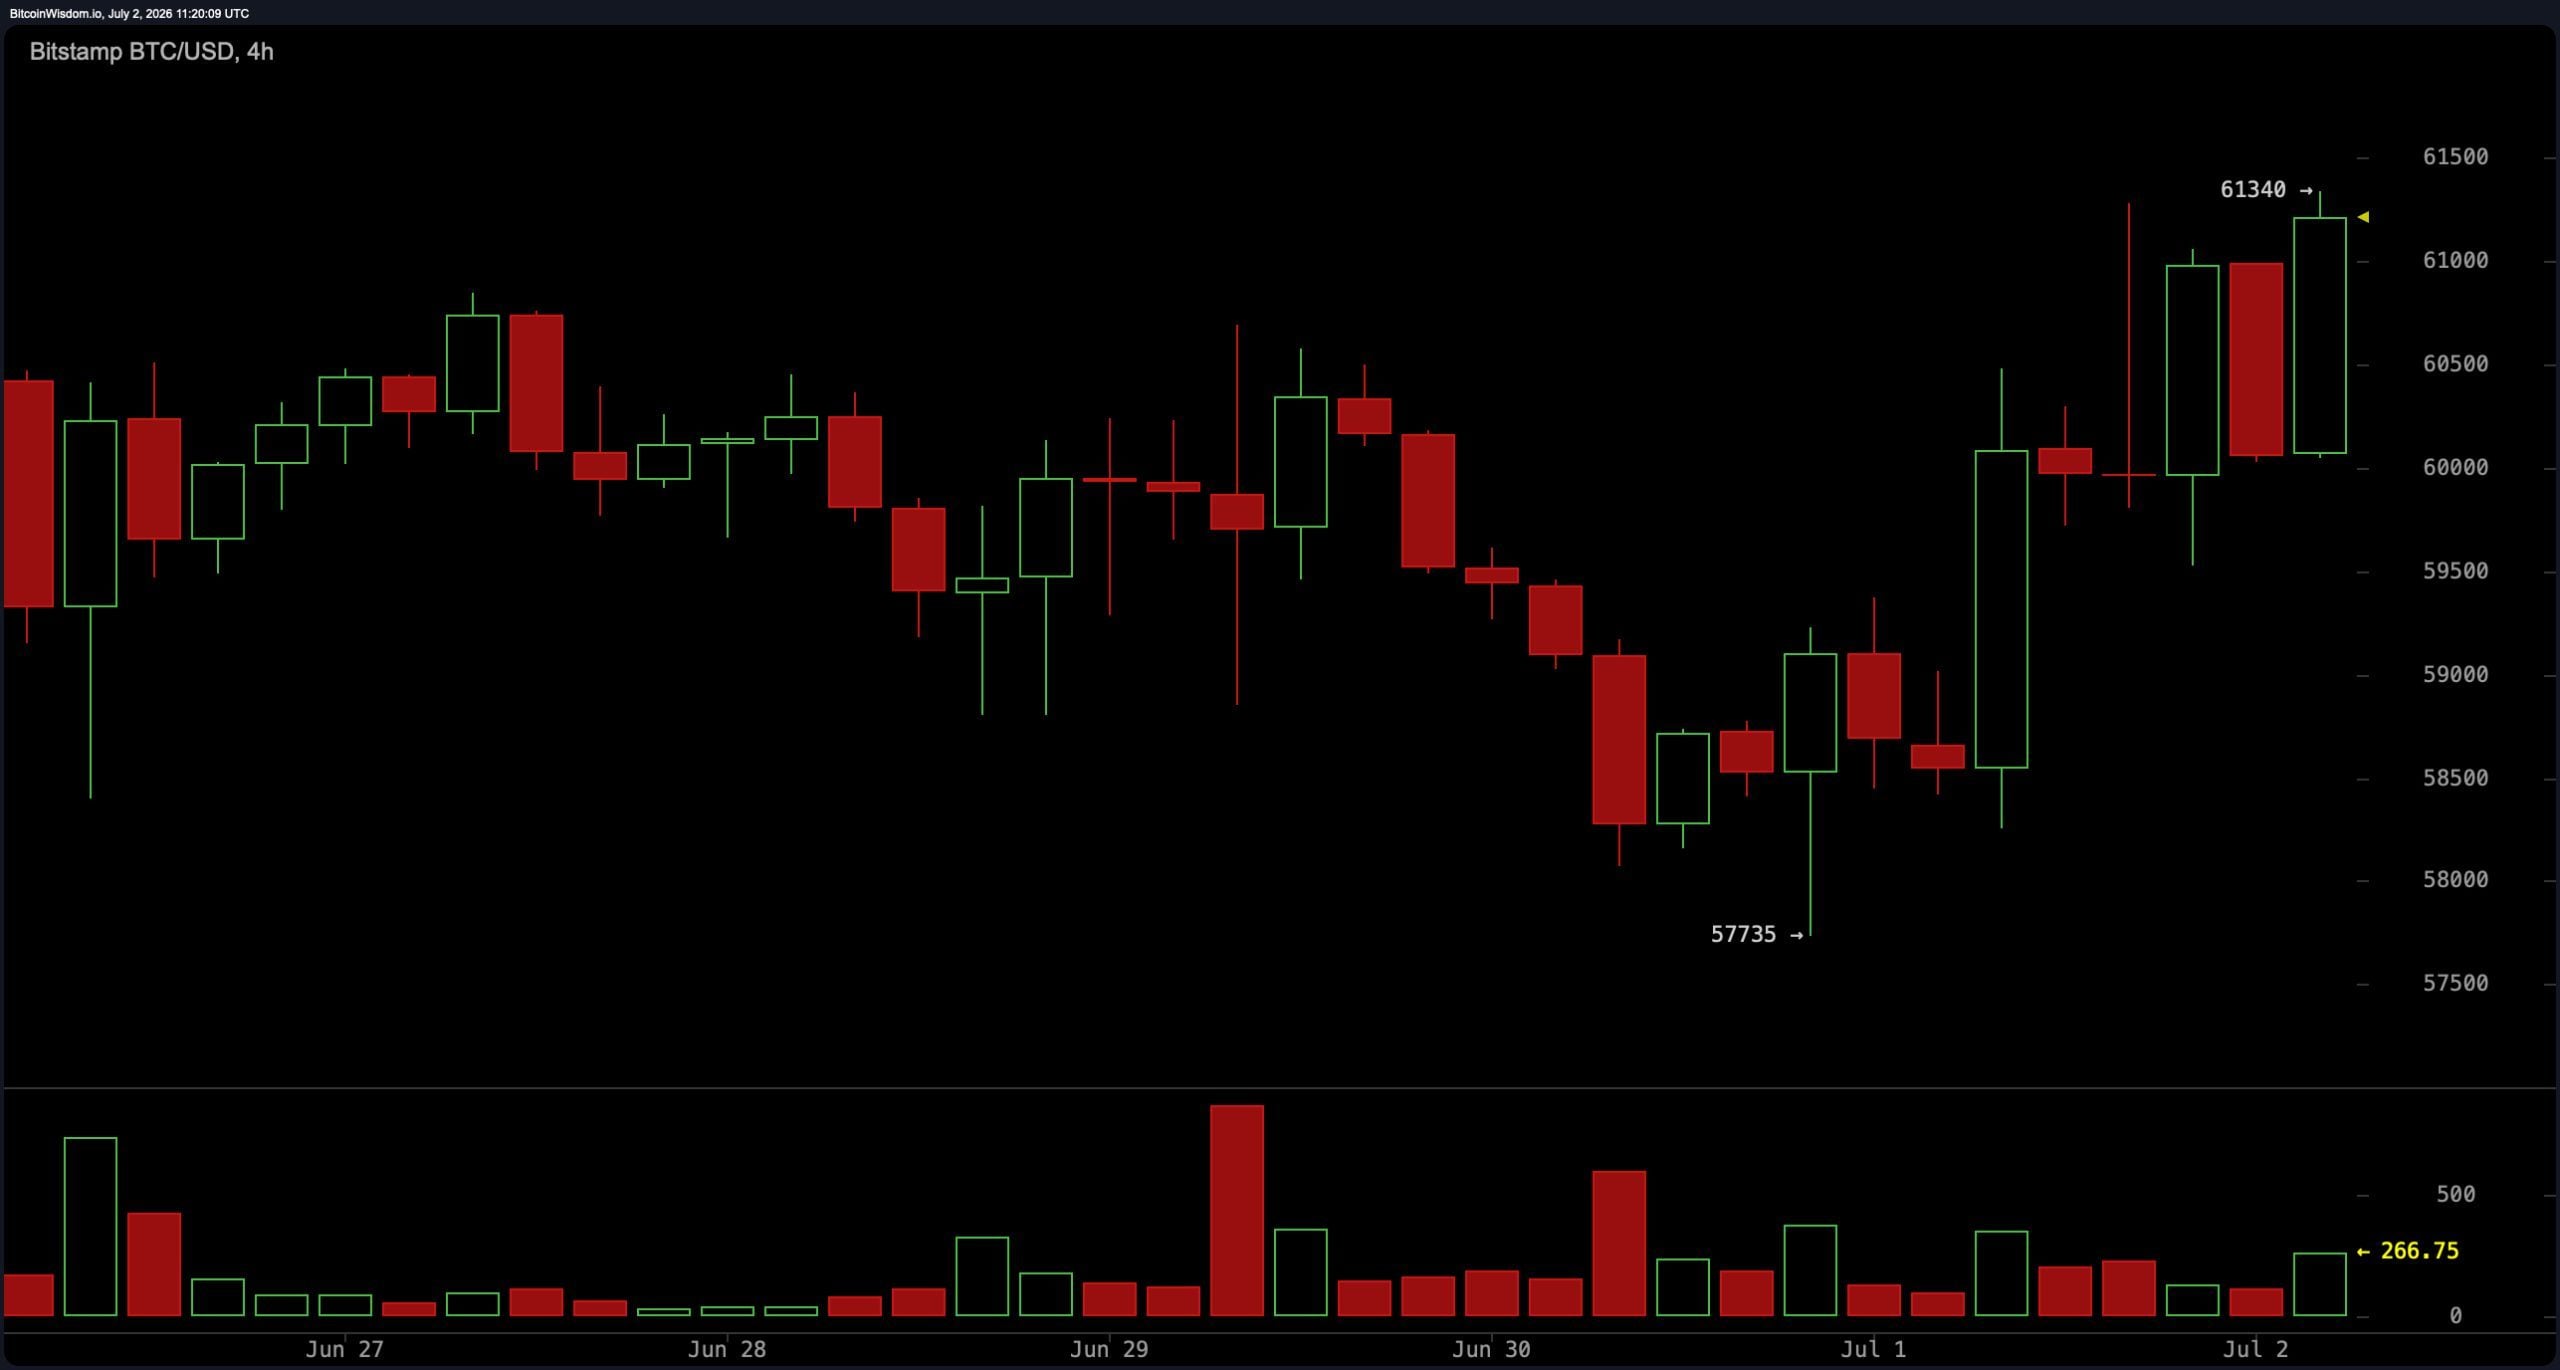
A breakout above that level on strong volume would open a path toward $62.5k, then $63.5k to $64k. Support on this timeframe sits near $60k, and a move below $59.6k would put the recent uptrend at risk.
One-Hour Chart Shows Momentum Starting to Cool
The 1-hour chart still shows a bullish trend, but the most recent candles are shrinking as price approaches resistance, a pattern that often comes before either a short consolidation or a brief pullback.
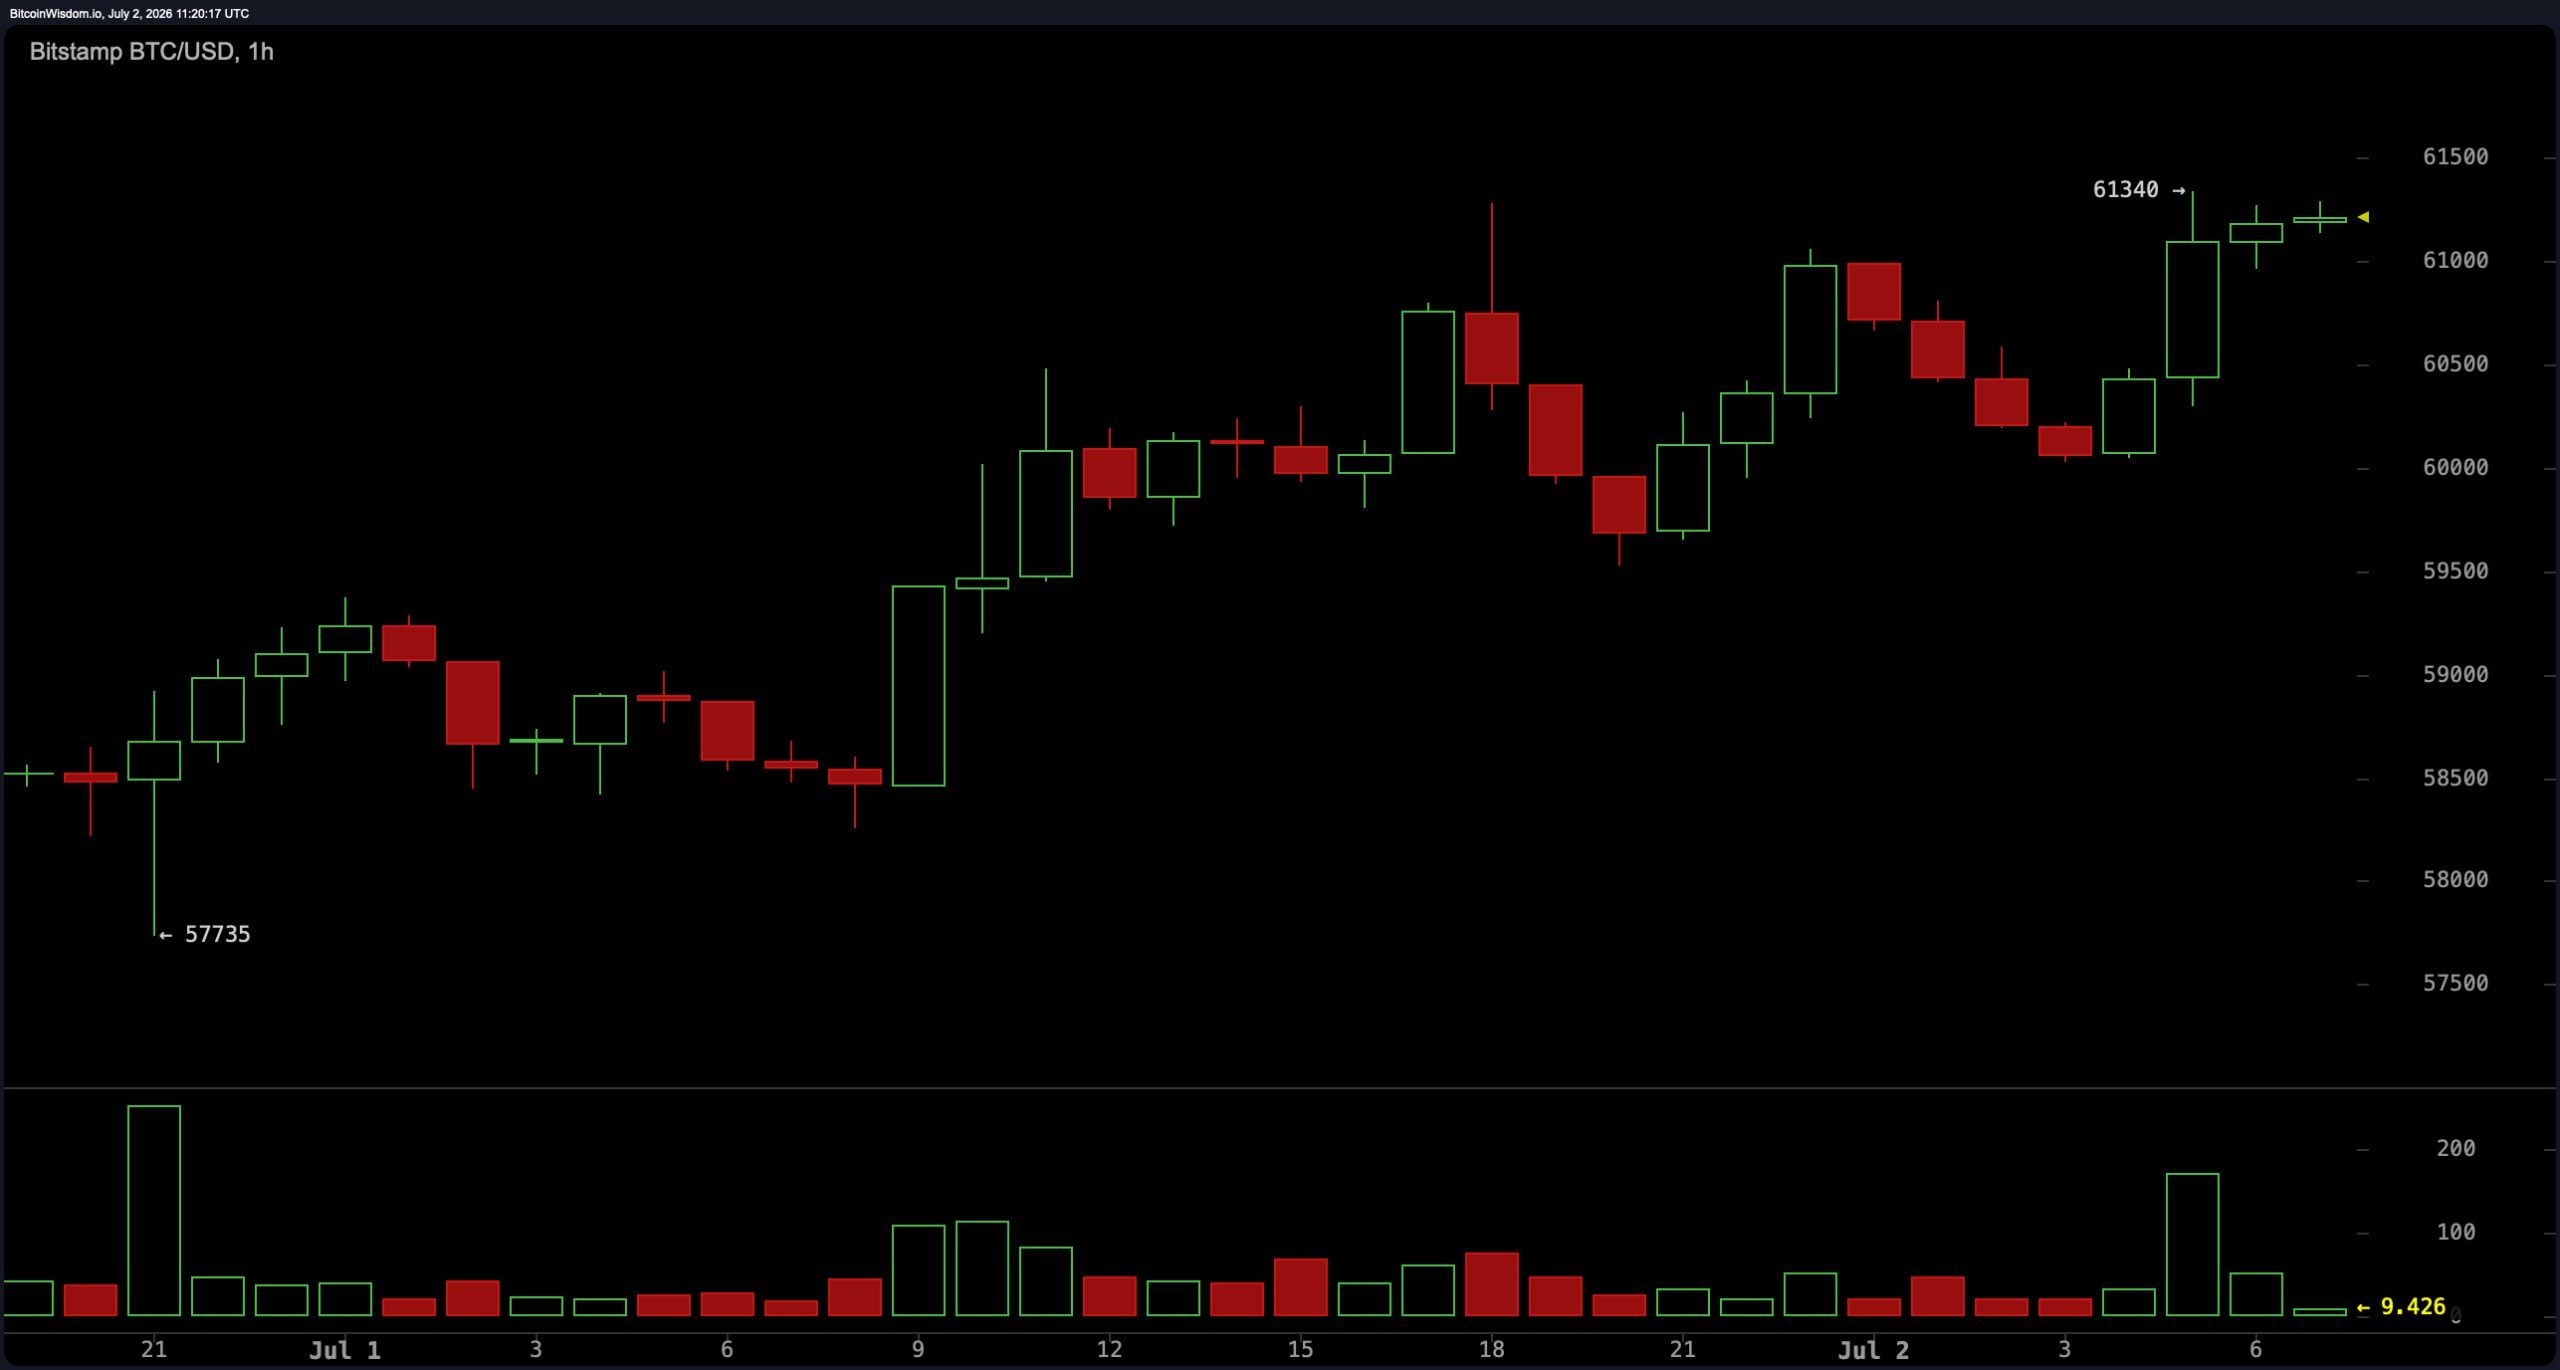
Immediate support sits at $60.8k to $61k, with stronger support underneath at $60k. Resistance sits at $61.3k, then $62k. A clean break above $61.3k on rising volume would confirm the next leg higher, while a slip below $60k would shift the short-term bias back toward the sellers.
Oscillators Stay Neutral but Momentum and MACD Signal Buy
Oscillator readings for BTC/USD daily chart on Bitstamp are mostly neutral, but two broke from that pattern. Momentum posted a negative 2,751, a bullish signal, and the moving average convergence divergence ( MACD) level came in at negative 2,084, also bullish.
The relative strength index ( RSI) sits at 43, the Stochastic at 26, the commodity channel index (CCI) at negative 51, and the average directional index (ADX) at 37, all neutral. The Awesome oscillator via the daily chart reads negative 3,892. None of these readings sit in overbought or oversold territory, leaving room for price to move either direction.
Short-Term Averages Turn Bullish While Longer-Term Averages Stay Bearish
The moving average (MA) picture splits sharply by timeframe. The 10-period Exponential Moving Average (EMA) sits at $60,652 and the 10-period Simple Moving Average (SMA) at $60,262, both reading buy with price trading above them.
Every longer average reads sell: the 20-period EMA at $62,047, the 20-period SMA at $62,346, the 30-period EMA at $63,597, the 30-period SMA at $62,443, the 50-period EMA at $66,127, the 50-period SMA at $67,728, the 100-period EMA at $69,929, the 100-period SMA at $71,146, the 200-period EMA at $76,026, and the 200-period SMA at $75,072. That split leaves bitcoin caught between near-term buy signals and a longer-term trend still working against it.
Bull Verdict:
Momentum and the MACD level both flipped to a bullish position, and the 10-period EMA and SMA now sit below the price rather than above it. The daily chart shows a higher low off $57.7k, the 4-hour chart shows a run of higher highs and higher lows, and volume over the past 24 hours reached $44.052 billion. A daily close above $61.3k to $62k confirms the shift and opens room toward $63.5k to $64k. As long as bitcoin holds above $60k, the short-term structure favors buyers.
Bear Verdict:
Nine of the twelve MAs tracked, from the 20-period through the 200-period, still read bearishness, and price remains well below the 50-period EMA at $66,127 and the 200-period EMA at $76,026. The 1-hour chart shows momentum cooling into resistance near $61.3k, a pattern that has preceded pullbacks before. A rejection at $61.3k on rising volume, or a loss of the $60k support level, opens a retest of $59k and potentially the $57.7k low the recovery started from.