

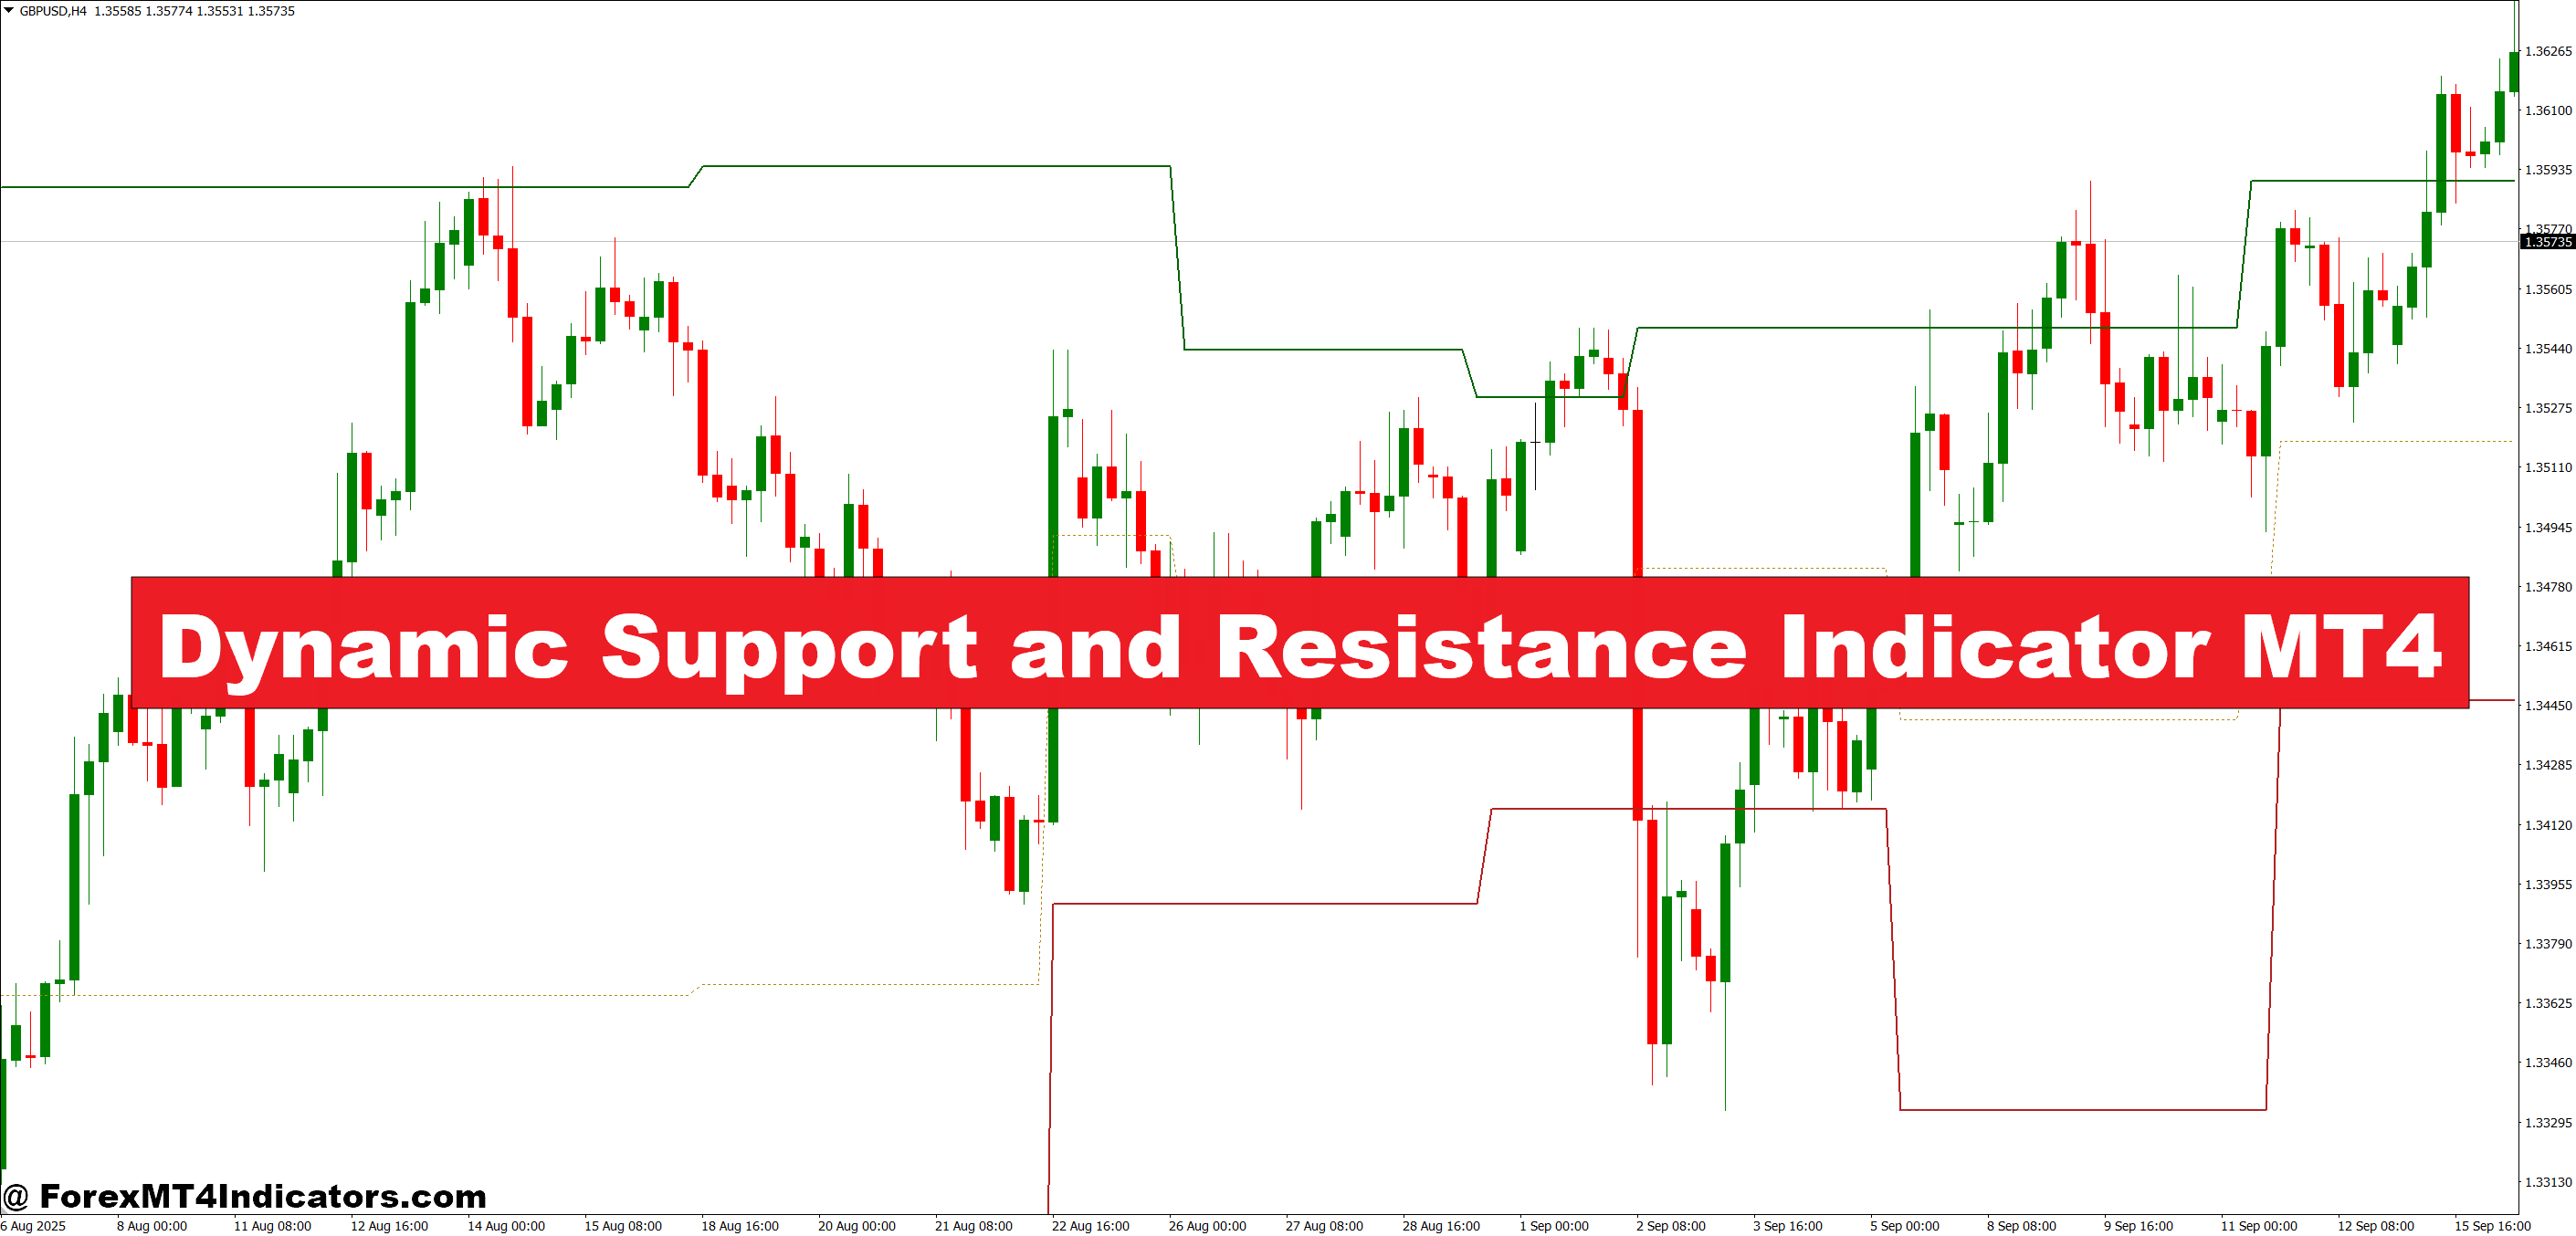
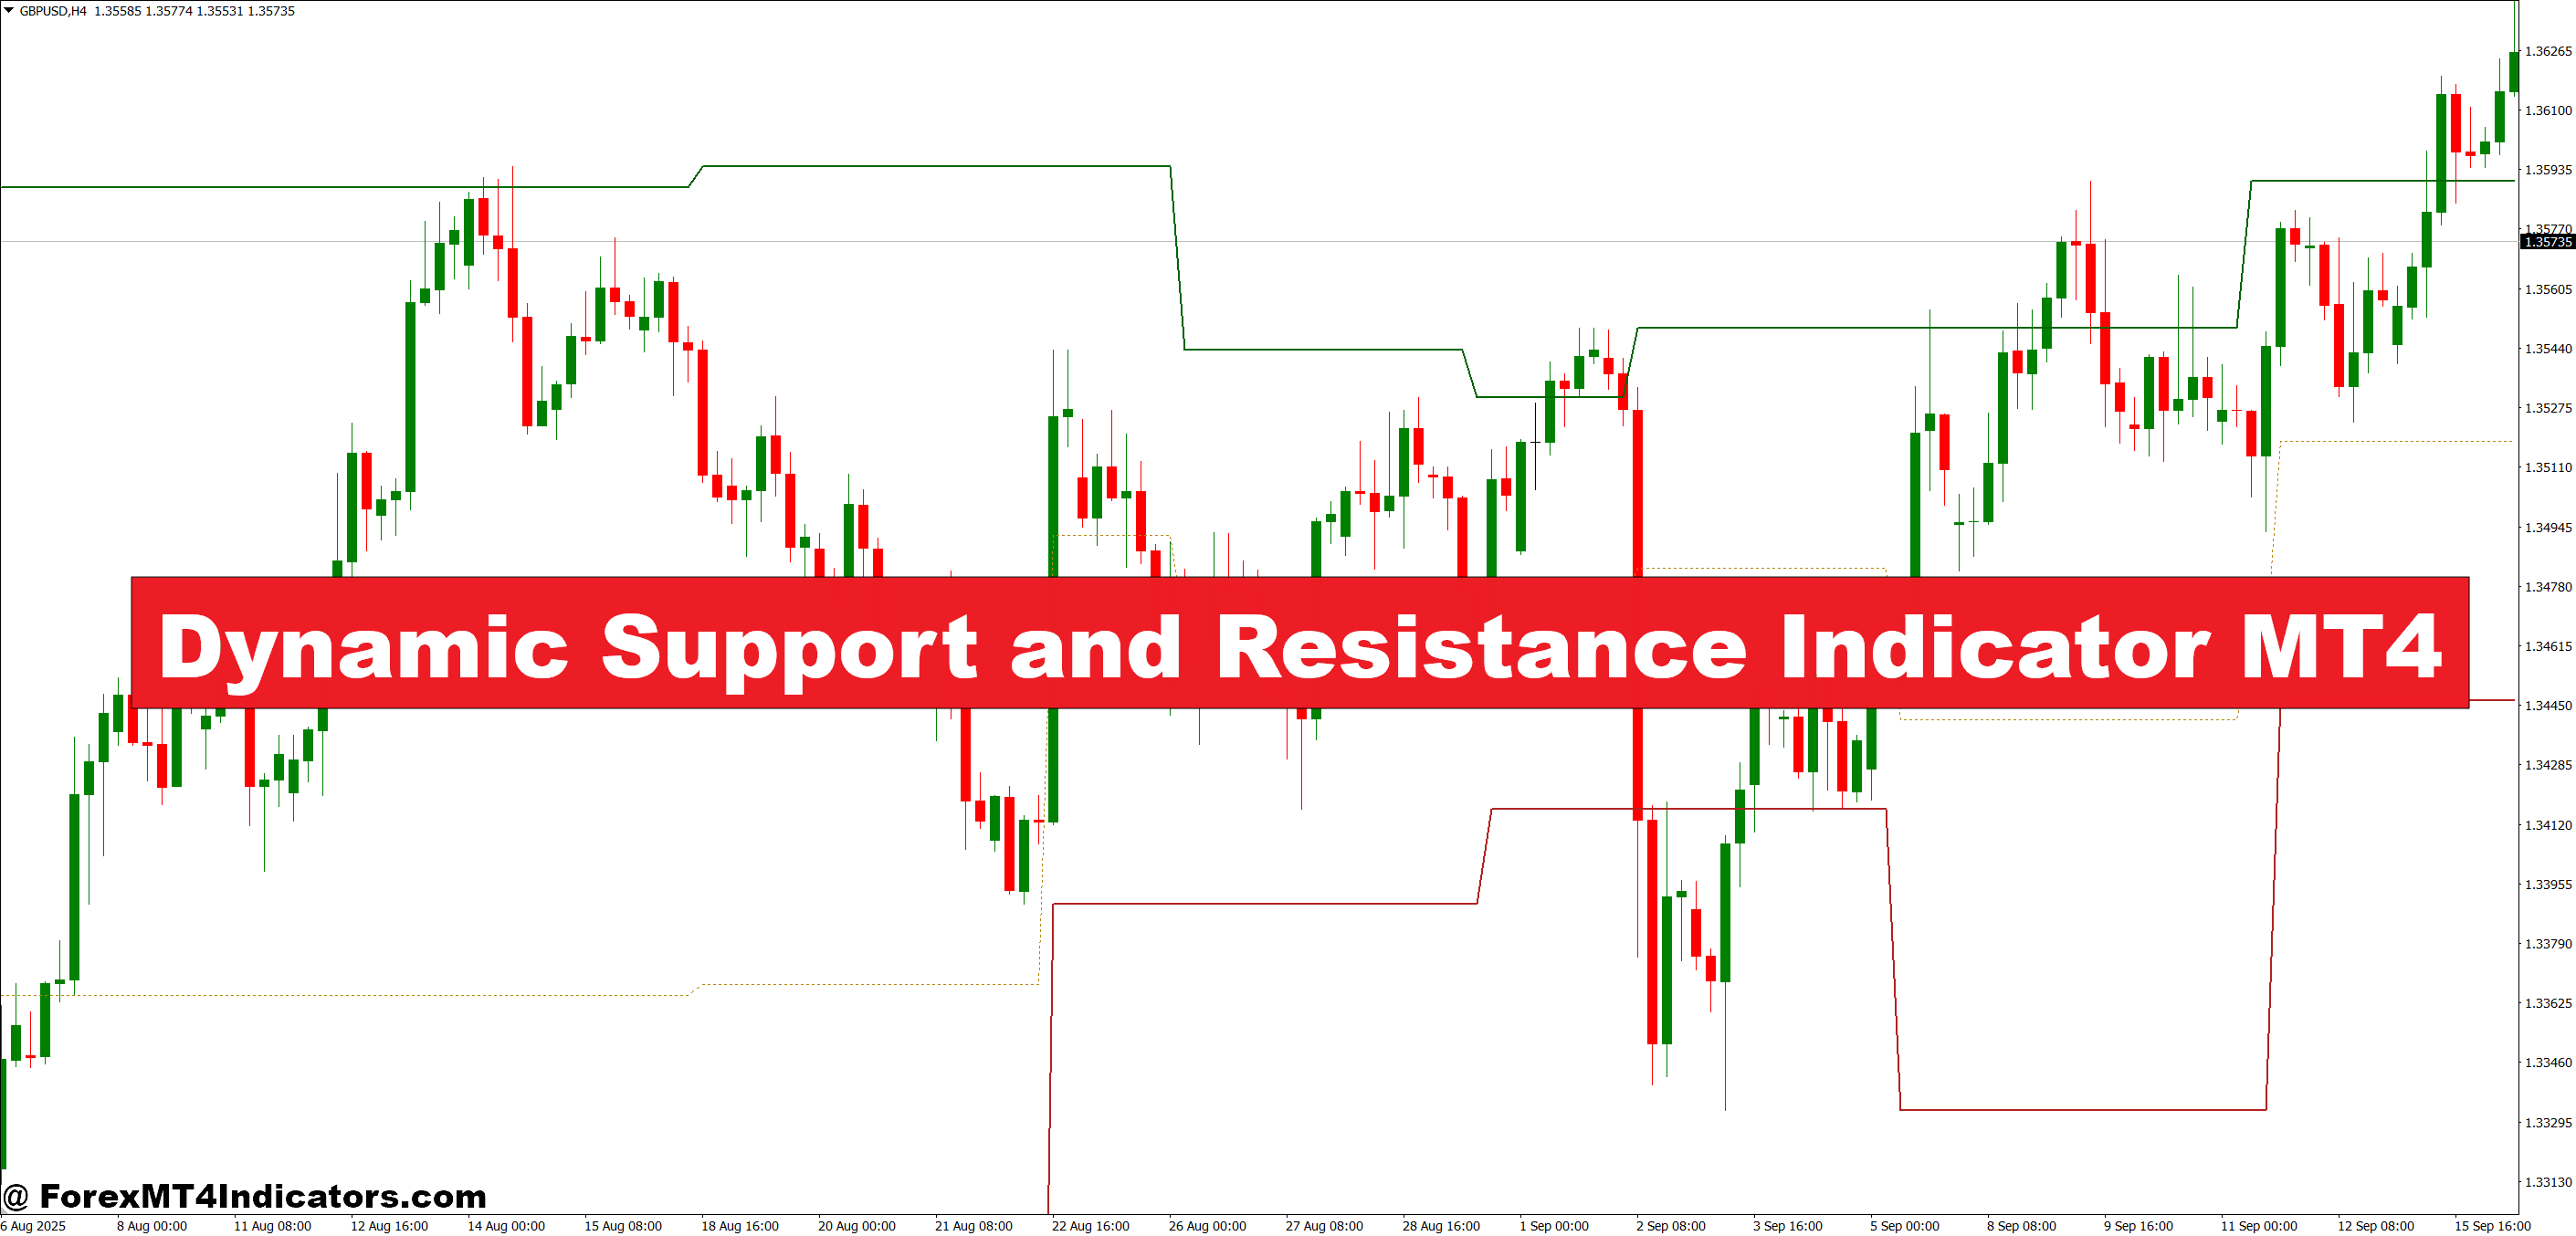
Unlike static S/R lines drawn at old swing highs and lows, this indicator calculates its levels dynamically — typically using a combination of pivot points, swing structure detection, and in some versions, moving average envelopes or ATR-based bands to define zone width.
The core logic identifies recent swing highs and lows within a defined lookback period, then projects these levels forward as active zones. Some MT4 versions also layer in volume or price density to determine “strong” versus “weak” levels. The result is a set of shaded zones or lines that update as new price data comes in, rather than relying on a snapshot from weeks ago.
Here’s the thing — most traders who come from manual analysis underestimate how much drift occurs in S/R levels over time. A level that held in January on GBP/USD may be irrelevant by March. Dynamic recalculation solves this.
Reading the Zones in Real Trades

On a 1-hour EUR/USD chart during a standard London session, the indicator might plot a support zone between 1.0820 and 1.0835. Price approaches from above, stalls, prints a bullish engulfing candle — and that’s a tradeable signal. The zone didn’t appear because a trader manually marked it the night before; it was calculated automatically from the most recent swing structure.
The setup works better on higher timeframes, though. When testing this on 4-hour GBP/JPY charts, the zones held considerably more often than on the 15-minute, where fast-moving, choppy sessions created too much noise. During volatile NFP days, the indicator can temporarily lag behind sudden range expansion, so treating its levels as “approximate zones” rather than exact lines is the right mindset.
For entries, many traders combine the dynamic zones with a confirmation tool — a 14-period RSI divergence or a simple moving average crossover on the M30. The zone identifies where to look. The confirmation decides when to act.
Risk warning: Trading forex carries substantial risk. No indicator, including this one, guarantees profitable results. Always use a stop loss and size positions according to your risk tolerance.
Dynamic Support and Resistance Indicator MT4 Settings and Customization
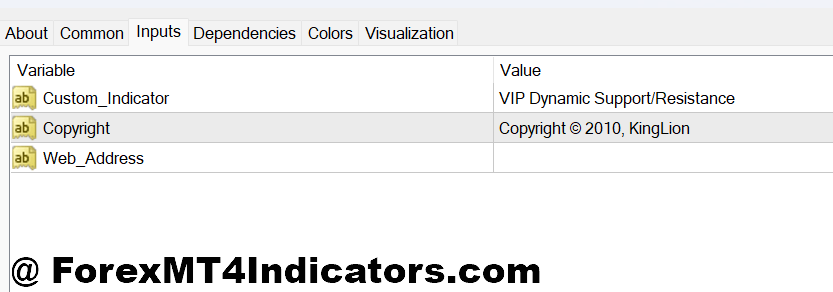
The default settings on most MT4 builds include a lookback period of around 20-50 bars for swing detection. Scalpers running the 5-minute chart typically reduce this to 10-15 bars to catch tighter, more recent structure. Swing traders on the daily chart often push it to 100+ bars to pick up major institutional levels.
Zone width is usually governed by an ATR multiplier. A setting of 0.5 ATR creates tight zones suited for trending markets. Bumping it to 1.0-1.5 ATR makes more sense during ranging or high-volatility sessions when price has more wiggle room before committing to a direction.
Color-coding matters more than it might seem. Using a distinct color for support zones versus resistance zones cuts down on hesitation during live trading. Most MT4 versions allow full customization here. Spend five minutes setting it up cleanly before going live — small detail, real difference.
Advantages and Honest Limitations

The biggest advantage is time savings. Drawing S/R levels manually on four pairs across three timeframes takes a solid 20-30 minutes of preparation. This indicator handles it automatically and updates in real time.
But there are real limitations that deserve honesty. The indicator performs weakest during extended consolidation phases — long sideways chop creates overlapping zones that clutter the chart and produce false signals. Traders who run it during the Asian session on low-volatility pairs like AUD/CHF often find the zones too closely stacked to be useful.
It also doesn’t replace understanding why a level matters. An S/R zone near a round number (like 1.1000 on EUR/USD) or a prior month’s high carries psychological weight that the indicator can’t quantify. Experienced traders use the tool to confirm what they already suspect, not to replace market reading entirely.
Compared to a standard pivot point indicator, the dynamic S/R tool is more adaptive but also more complex to interpret. Standard daily pivots give clean, widely-watched levels — something large institutions and retail traders both monitor. The dynamic version is more nuanced but less universal. Neither is strictly better; they serve different purposes.
How to Trade with Dynamic Support and Resistance Indicator MT4
Buy Entry

- Price touches dynamic support zone – Wait for price to reach the highlighted support band on the 1-hour or 4-hour chart before considering an entry.
- Bullish candle closes above zone midline – A full bullish candle close inside or just above the support zone confirms buyers are defending the level.
- Zone holds on retest – If price dips into the zone, bounces, pulls back, and holds again, the second touch is often the stronger entry.
- RSI below 40 at zone touch – Oversold momentum aligning with dynamic support on EUR/USD or GBP/USD adds meaningful confluence.
- Place stop 10-15 pips below zone low – Position your stop beneath the entire support band, not just the nearest line, to avoid normal wick noise.
- Target the next dynamic resistance zone – Use the indicator’s upper plotted level as your first take-profit, typically 1:2 risk-to-reward minimum.
- Avoid entries during NFP or high-impact news – Zone levels lose reliability when volatility spikes unpredictably within minutes.
- Skip signal if zones are stacked within 20 pips – Overlapping levels signal choppy conditions; wait for cleaner chart structure.
Sell Entry

- Price rejects dynamic resistance zone – Look for price to push into the resistance band and fail to close above it on the 1-hour or 4-hour chart.
- Bearish candle closes below zone midline – A strong bearish close back inside or beneath the resistance zone confirms sellers are active at that level.
- Zone rejection on GBP/USD daily chart – Daily timeframe rejections carry more weight; a single daily bearish candle at resistance is worth watching closely.
- RSI above 60 at zone touch – Overbought momentum meeting dynamic resistance strengthens the case for a short entry significantly.
- Place stop 10-15 pips above zone high – Cover the full resistance band with your stop to avoid getting stopped out by shallow wicks before price reverses.
- Target next dynamic support zone as TP1 – Let the indicator guide your exit by marking the nearest lower support band as your first profit target.
- Don’t sell into a strong uptrend – If price is making consistent higher highs and the zone has already broken twice, the level is likely too weak to hold.
- Avoid during Asian session on low-volatility pairs – Tight ranges produce false rejections; stick to London or New York sessions for reliable sell signals.
Getting the Most Out of This Indicator
Traders who stick with this tool long-term tend to do a few things consistently. They treat the zones as areas, not lines. They confirm signals with at least one other factor — trend direction, candlestick pattern, or momentum. And they track their results by zone type (support vs. resistance, strong vs. weak) to see where the indicator actually performs for their preferred pairs and timeframes.
The Dynamic Support and Resistance Indicator for MT4 isn’t a shortcut to profitability. But used with realistic expectations and proper confirmation, it removes a genuine inefficiency from most traders’ workflows. The market’s structure is always there — this tool just helps map it faster. Start on a demo account, run it across 50-100 trades, and let the data tell the story.
Recommended MT4/MT5 Broker
XM Broker
- Free $50 To Start Trading Instantly! (Withdraw-able Profit)
- Deposit Bonus up to $5,000
- Unlimited Loyalty Program
- Award Winning Forex Broker
- Additional Exclusive Bonuses Throughout The Year
- Exclusive 90% VIP Cash Rebates for all Trades!

>> Sign Up for XM Broker Account here with Exclusive 90% VIP Cash Rebates For All Future Trades [Use This Special Invitation Link] <<
Already an XM client but missing out on cashback? Open New Real Account and Enter this Partner Code: VIP90
