


RSI HEATMAP
– Momentum, Dynamic Support/Resistance, and Multi-Symbol Chart Navigation –

MQL5 Blogs :
MT4 Version :
MT5 Version :
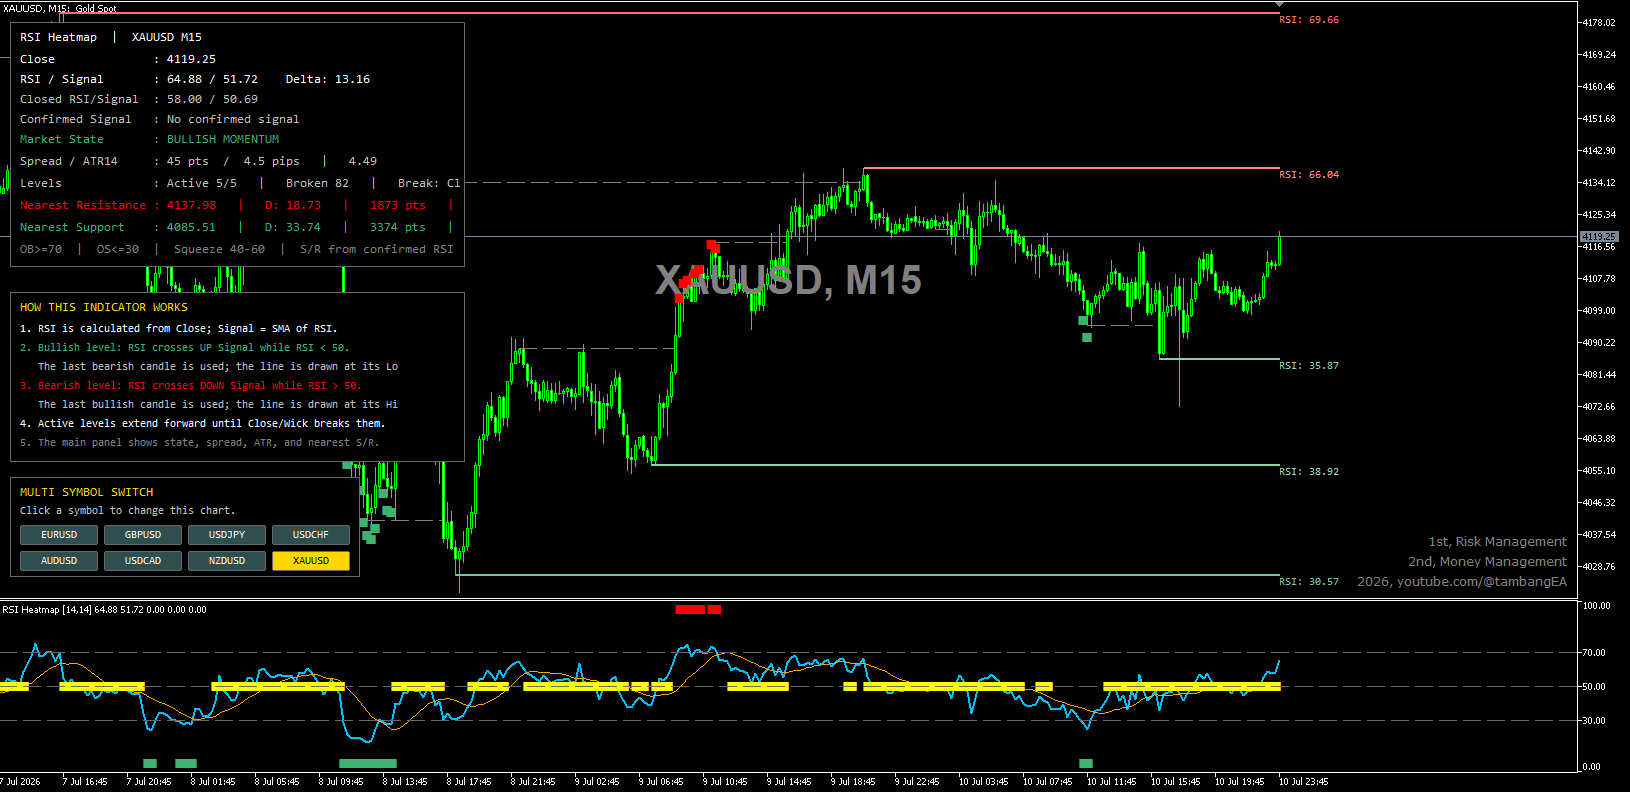
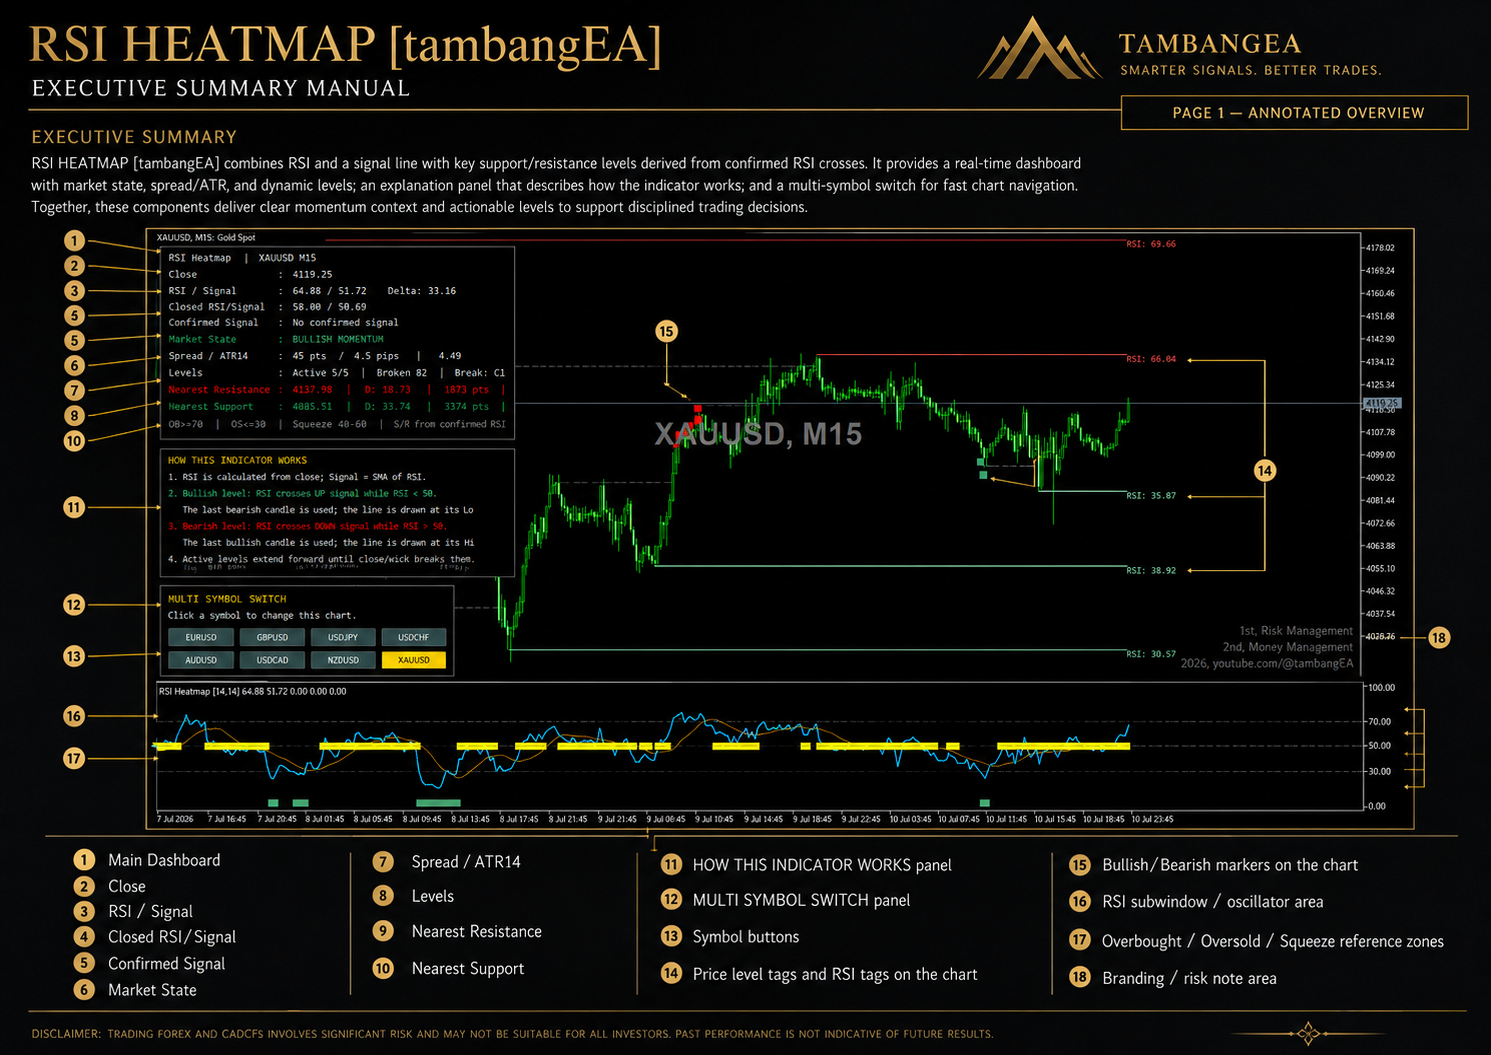
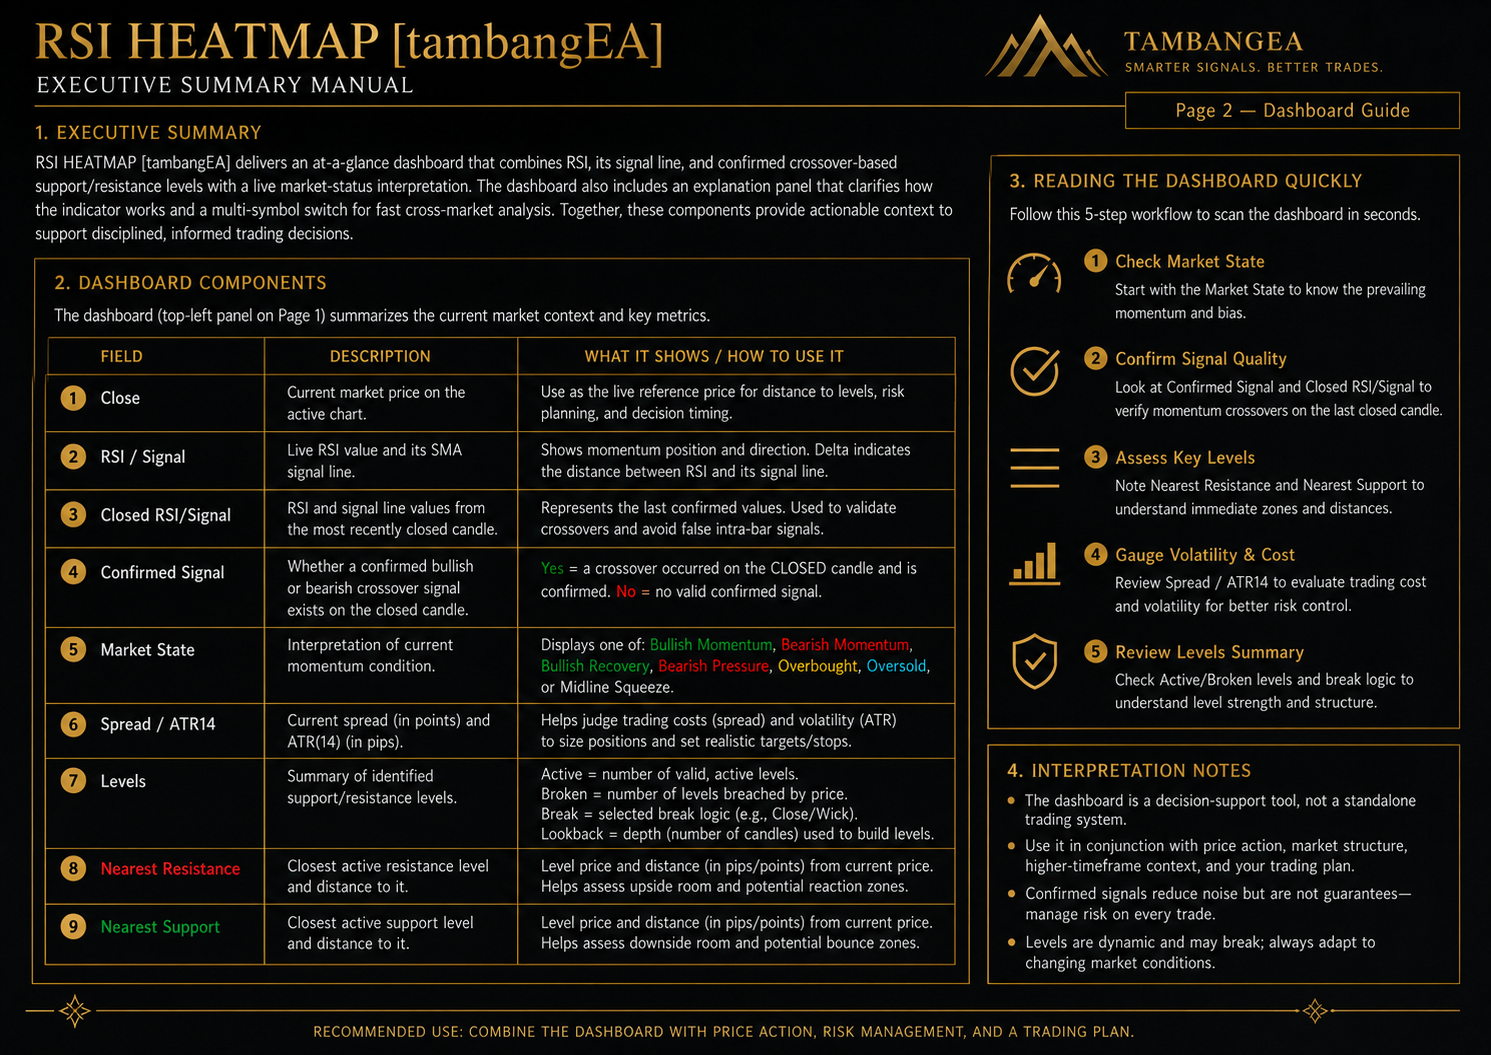
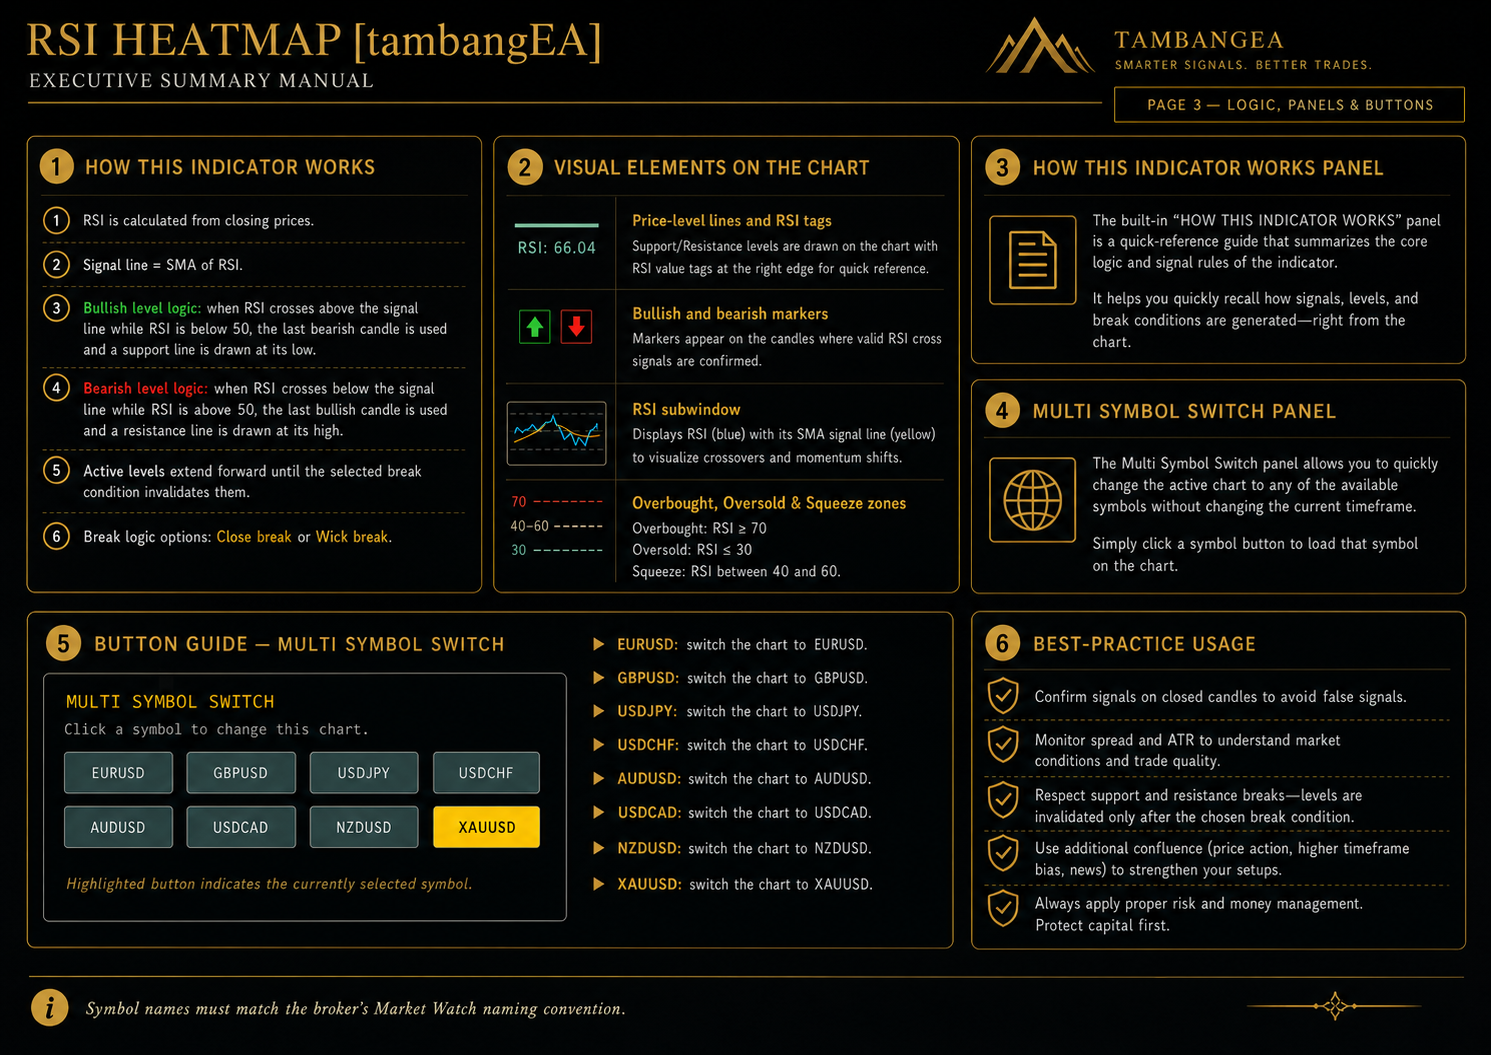
RSI HEATMAP [tambangEA] is a professional momentum and market-structure indicator that combines the Relative Strength Index, an RSI signal line, confirmed crossover logic, dynamic support and resistance levels, real-time market information, and fast multi-symbol chart navigation.
The indicator is designed to help traders understand momentum direction, identify important reaction levels, monitor volatility and trading costs, and quickly switch between selected symbols without manually reopening charts.
It is suitable for Forex, Gold, indices, commodities, and other instruments supported by MetaTrader.
Main Features
- RSI oscillator with an SMA-based signal line
- Confirmed RSI crossover detection
- Dynamic bullish support levels
- Dynamic bearish resistance levels
- Nearest support and resistance calculation
- Overbought, oversold, and squeeze visualization
- Bullish and bearish confirmation markers
- Real-time dashboard
- Current and closed-candle RSI information
- Spread and ATR monitoring
- Active and broken level statistics
- Close-based or wick-based level invalidation
- Multi-symbol chart switch panel
- Automatic preservation of the current timeframe when changing symbols
- Customizable symbol list
- Forex and XAU/GOLD point and pip normalization
- Dark chart-compatible interface
- Consolas dashboard font for clear numerical alignment
How the Indicator Works
RSI and Signal Line
The indicator calculates the standard RSI from closing prices.
The signal line is calculated as a Simple Moving Average of the RSI values.
This combination helps identify changes in momentum more clearly than using a single RSI line alone.
Bullish Level Logic
A bullish condition is confirmed when:
- RSI crosses above its signal line
- RSI remains below the 50 level at the time of the crossover
- The crossover occurs on a completed candle
After confirmation, the indicator searches backward for the latest bearish candle within the configured lookback range.
The low of that bearish candle is used as a dynamic bullish support level.
The level extends forward until it is invalidated by the selected break condition.
Bearish Level Logic
A bearish condition is confirmed when:
- RSI crosses below its signal line
- RSI remains above the 50 level at the time of the crossover
- The crossover occurs on a completed candle
After confirmation, the indicator searches backward for the latest bullish candle within the configured lookback range.
The high of that bullish candle is used as a dynamic bearish resistance level.
The level extends forward until it is invalidated by the selected break condition.
Break Logic
The indicator supports two level invalidation methods.
Close Break
A support or resistance level is considered broken only when a candle closes beyond the level.
This method helps reduce false invalidation caused by temporary wick penetration.
Wick Break
A level is considered broken as soon as the candle high or low crosses the level.
This method reacts faster but may produce more frequent level invalidation during volatile market conditions.
RSI Heatmap and Reference Zones
The RSI subwindow displays the RSI line, signal line, and momentum reference zones.
Overbought Zone
RSI greater than or equal to 70 indicates an overbought condition.
An overbought reading does not automatically mean that the market must reverse. During strong bullish trends, RSI may remain overbought for an extended period.
Oversold Zone
RSI less than or equal to 30 indicates an oversold condition.
An oversold reading does not automatically mean that the market must rise. During strong bearish trends, RSI may remain oversold for an extended period.
Midline Squeeze Zone
RSI between 40 and 60 represents a neutral or compressed momentum condition.
This area may indicate:
- consolidation,
- accumulation,
- distribution,
- reduced momentum,
- or preparation for a new directional move.
Dashboard Information
The main dashboard displays important real-time information.
Close
Shows the current market price of the active symbol.
RSI / Signal
Displays the live RSI value and the live RSI signal-line value.
The Delta value represents the numerical distance between RSI and its signal line.
Closed RSI / Signal
Displays RSI and signal-line values from the most recently completed candle.
These values are used to confirm crossover conditions and reduce intrabar signal noise.
Confirmed Signal
Shows whether the latest completed candle contains a valid bullish or bearish RSI crossover condition.
Possible information includes:
- Bullish block confirmed
- Bearish block confirmed
- No confirmed signal
Market State
The dashboard interprets the current RSI condition and may display:
- Bullish Momentum
- Bearish Momentum
- Bullish Recovery
- Bearish Pressure
- Overbought
- Oversold
- Midline Squeeze
- Neutral
Spread / ATR14
Displays:
- current spread in points,
- current spread in pips,
- and the ATR(14) value.
This information helps traders evaluate current trading cost and market volatility.
Levels
Displays:
- number of active levels,
- maximum permitted active levels,
- number of broken levels,
- selected break method,
- and level-construction lookback depth.
Nearest Resistance
Shows the closest active resistance above the current market price.
The dashboard also displays its distance in:
- raw price,
- points,
- pips,
- and percentage.
Nearest Support
Shows the closest active support below the current market price.
The dashboard also displays its distance in:
- raw price,
- points,
- pips,
- and percentage.
How This Indicator Works Panel
The built-in explanation panel provides a quick reference directly on the chart.
It summarizes:
- RSI calculation,
- signal-line calculation,
- bullish level logic,
- bearish level logic,
- level extension,
- and level invalidation.
This panel is useful for traders who need to review the indicator rules without opening external documentation.
Multi-Symbol Switch Panel
The Multi-Symbol Switch panel allows traders to change the active chart symbol with one click.
The current timeframe remains unchanged when the symbol is switched.
Default buttons may include:
- EURUSD
- GBPUSD
- USDJPY
- USDCHF
- AUDUSD
- USDCAD
- NZDUSD
- XAUUSD
The highlighted button indicates the currently selected chart symbol.
Symbol names must match the broker’s Market Watch naming format.
For example, brokers may use:
- EURUSD
- EURUSDm
- EURUSD.a
- XAUUSD
- XAUUSDm
- GOLD
- GOLD.pro
The symbol list can be customized from the indicator inputs.
Recommended Usage
RSI HEATMAP [tambangEA] is best used as a decision-support and confirmation tool.
A recommended workflow is:
- Check the current Market State.
- Review the Closed RSI/Signal values.
- Check whether a confirmed crossover exists.
- Identify the nearest support and resistance.
- Review spread and ATR conditions.
- Confirm the setup with price action.
- Apply proper stop-loss and position sizing.
- Avoid entering solely because RSI is overbought or oversold.
For stronger confirmation, traders may combine the indicator with:
- market structure,
- candlestick patterns,
- trend direction,
- moving averages,
- higher-timeframe analysis,
- supply and demand zones,
- session filters,
- and economic-news awareness.
Example Bullish Interpretation
A potential bullish setup may occur when:
- RSI crosses above its signal line below 50,
- a bullish support level is created,
- price remains above the support,
- price retests the level,
- and bullish price action appears.
A stop-loss may be placed below the support level with an appropriate volatility buffer.
The nearest resistance may be used as a potential target or trade-management reference.
Example Bearish Interpretation
A potential bearish setup may occur when:
- RSI crosses below its signal line above 50,
- a bearish resistance level is created,
- price remains below the resistance,
- price retests the level,
- and bearish price action appears.
A stop-loss may be placed above the resistance level with an appropriate volatility buffer.
The nearest support may be used as a potential target or trade-management reference.
Important Notes
- This product is an indicator, not an Expert Advisor.
- It does not automatically open or close trades.
- Signals are based on RSI conditions and market structure.
- Level creation uses confirmed candle logic.
- Live RSI values may continue changing while the current candle is open.
- Support and resistance levels are not guaranteed to hold.
- Strong trends may keep RSI overbought or oversold for long periods.
- Spread, execution conditions, and symbol specifications vary between brokers.
- Historical performance does not guarantee future results.
Risk Warning
Trading Forex, Gold, CFDs, and other leveraged instruments involves substantial risk.
This indicator does not guarantee profits and should not be treated as financial advice or as a complete trading system.
Always use appropriate risk management, money management, stop-loss protection, and position sizing.
Never trade with funds that you cannot afford to lose.
Suggested Product Summary
RSI HEATMAP [tambangEA] combines RSI momentum analysis, a signal line, confirmed crossover-based support and resistance levels, a real-time dashboard, ATR and spread information, and one-click multi-symbol chart navigation.