

GBP/JPY has pulled sharply lower after failing to hold its recent highs, bringing the 213.00 area back into focus.
The move suggests downside momentum has picked up, but the pair is now trading in a zone where sellers may need fresh follow-through to stay in control.
For traders, the key question is whether this drop marks the beginning of a deeper pullback, or whether the latest slide has already gone far enough to attract dip-buying interest.
This is a “watch closely” moment: a quick stabilization near current levels could hint at a rebound attempt, while continued weakness below 213.00 may point to a broader bearish shift.
Welcome to “TA Alert of the Day.” Each day after the market close, MarketMilk scans for popular technical indicator alerts. We use these alerts as the basis for a mini-lesson, breaking down what each alert means, why it matters, and how traders might interpret it. The goal is to help beginner traders not only spot these alerts but also understand the logic behind them and how they can inform trading decisions.
What MarketMilk Has Detected
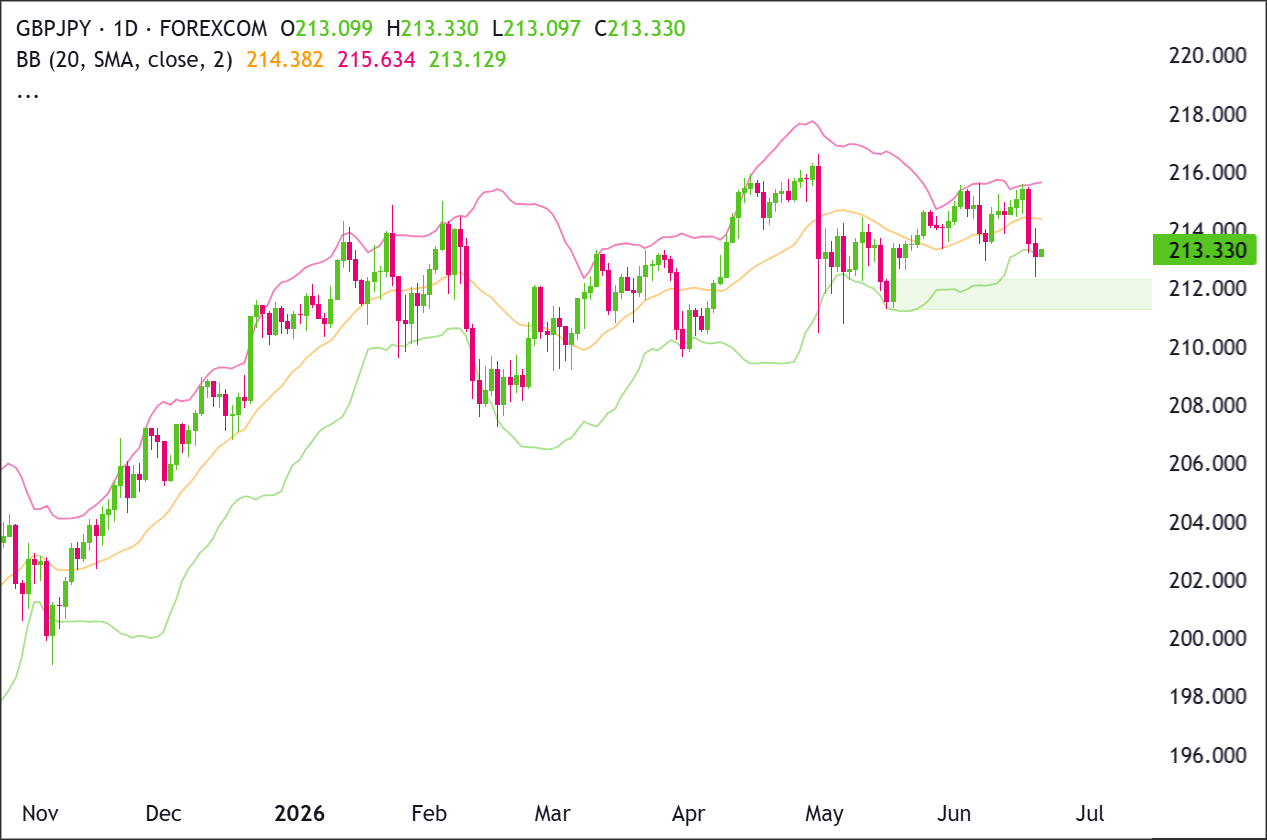
GBP/JPY’s daily close (213.092) has crossed below the lower Bollinger Band (20,2), with the band sitting near 213.216 on the signal bar.
This indicates that the latest downswing has expanded beyond what the last 20 sessions would define as a typical downside excursion.
The breach follows a notable pullback from recent highs around 215.56 and a decisive “give-back” day this past Wednesday.
What This Signals
A close below the lower Bollinger Band can attract mean-reversion interest, because it suggests price has moved unusually far, unusually fast relative to its recent volatility baseline.
In the classic Bollinger interpretation, a lower band breach can sometimes coincide with a short-term washout, after which price attempts to revert toward the middle band (currently around 214.40) if selling pressure eases.
If the move is sustained back inside the bands, it often marks an improving balance between buyers and sellers.
However, this same pattern can also represent trend acceleration rather than exhaustion.
In persistent downswings, price can “walk the band,” where repeated closes near or below the lower band reflect continued supply and shallow bounces.
In that scenario, the breach is less about reversal and more about confirming that downside volatility is expanding, especially if rallies stall near former support turned resistance around 214.30–214.80.
Alternatively, the signal may also highlight a volatility event rather than a directional edge.
Bollinger Band breaches frequently occur during news-driven moves, and the first reaction can be choppy: a snapback attempt followed by another push lower.
That kind of two-step behavior is where traders often see false starts, particularly if the next daily candle fails to reclaim the lower band.
The outcome depends heavily on follow-through price action, volatility conditions, and where the move is occurring relative to recent support/resistance.
How It Works
Bollinger Bands plot a 20-period moving average (the middle band) and two envelopes set a number of standard deviations above and below it (here, 2 standard deviations).
The bands expand when volatility rises and contract when volatility falls. A close outside the bands indicates price has deviated beyond what has been typical over the lookback window.
Importantly, Bollinger Bands measure magnitude and dispersion, not direction.
A lower-band breach can precede a bounce (mean reversion), but it can also appear early in a sustained decline as the distribution of returns shifts and the bands “chase” price.
Important: Band breaches are generally more reliable when paired with additional evidence (e.g., a reclaim back inside the band, a supportive reversal candle, or confluence with a well-defined support level). Without confirmation, a breach can remain “just volatility,” especially in trending conditions.
What to Look For Before Acting
Do not assume an immediate reversal. Consider these factors:
✅ A daily close back above the lower band (a “re-entry” signal) rather than lingering below it
✅ Evidence of demand near 213.00–213.30 (rejection wicks, higher low attempts, or reduced downside follow-through)
✅ Whether price can reclaim and hold above the middle band (~214.40) over subsequent sessions (often a practical mean-reversion checkpoint)
✅ How rallies behave into 214.30–214.80 (does prior support act as resistance?)
✅ A check of the 4-Hour chart for basing behavior (e.g., compression, higher highs/lows) before trusting a daily bounce attempt
✅ Whether volatility is expanding further (wider bands + larger candles) or calming (narrower ranges), which can affect mean-reversion odds
✅ Nearby macro catalysts for GBP/JPY (BoE/BoJ messaging, UK data surprises, risk-sentiment moves that often influence JPY crosses)
Risk Considerations
⚠️ Band-walk risk: price can continue closing near/below the lower band in sustained selloffs
⚠️ Bull trap risk: a brief snapback can fail near 214.30–214.80 and roll over again
⚠️ News risk: daily moves can be distorted by headline-driven volatility, reducing signal clarity
⚠️ Support failure: a clean break under the 213.00 area can expose deeper support zones (e.g., 211.30–211.60)
Potential Next Steps
Consider keeping GBP/JPY on a short-term watchlist for a reclaim back inside the Bollinger Bands and signs that selling pressure is fading near the 213.00–213.30 zone.
Recent candles show a rejection from the 215.50-216.00 area, followed by a sharp pullback into 213.30.
Buyers now need to defend 212.00-213.10 and reclaim 214.40 to stabilize momentum.
Sellers need a daily close below 212.00 to confirm that the recent support structure has failed.
Trade Idea: Bullish Continuation Scenario
Setup
The bullish setup depends on GBP/JPY holding the 212.00-213.10 support zone and turning higher from the lower side of the recent range.
A stronger bullish confirmation would come from a daily close above 215.65, which would show buyers have reclaimed the recent resistance area and are attempting to continue the broader uptrend.
Entry
Consider entering long on a daily close above 215.65, confirming that buyers are breaking out of the recent structure.
Alternatively, enter on a controlled pullback into 212.00-213.10 if price stabilizes there and turns back higher.
If price loses that support zone and closes decisively below 212.00, stand aside and wait for either deeper support to form or a cleaner breakout later.
Stop Loss
For breakout entries: stop on a daily close back below 214.40. That would invalidate the breakout by showing price could not stay above the former ceiling.
For pullback entries: stop on a daily close below 212.00. That would invalidate the support-hold idea and show buyers are no longer defending the zone.
Take Profit
Target 217.50-218.00, because that is the next clear upside area on the chart and the most natural place for price to retest if the current recovery continues.
Bottom Line
The bullish case improves if GBP/JPY holds 212.00-213.10 and closes above 215.65.
That would suggest the pullback has been absorbed and buyers are pushing back toward the recent high zone.
The upside target is 217.50-218.00, while the key invalidation level is 212.00. A daily close below 212.00 would weaken the bullish continuation setup and point to a deeper pullback.
Trade Idea: Bearish Pullback Scenario
Setup
The bearish setup comes from the rejection at 215.50-216.00 and the current pullback toward support.
Sellers need price to lose 212.00 to confirm that the recent range has broken lower. Until then, the decline is still only a pullback within the broader uptrend.
Entry
Consider entering short on a daily close below 212.00, confirming that the support zone has failed.
Alternatively, if price pushes into 214.40-215.65 and prints a clear bearish rejection candle, enter short on the next daily close back below 214.00.
If price instead breaks and closes decisively above 215.65, stand aside, as that would invalidate the bearish pullback idea.
Stop Loss
For breakdown entries: stop on a daily close back above 213.10. That would invalidate the breakdown by showing price has reclaimed the support zone.
For rejection entries near resistance: stop on a daily close above 215.65. That would invalidate the bearish idea by confirming buyers have pushed through resistance.
Take Profit
Target 210.00-210.50, because that is the next major support area below the current structure and the most likely place where buyers would try to step back in.
Bottom Line
The bearish case strengthens if GBP/JPY fails below 214.40-215.65 and then closes under 212.00. That would confirm sellers have taken control of the short-term structure.
The downside target is 210.00-210.50, while bearish invalidation sits above 215.65. A daily close above 215.65 would shift the structure back in favor of buyers and weaken the pullback scenario.
This content is strictly for informational purposes only and does not constitute as investment advice. Trading any financial market involves risk. Please read our Risk Disclosure to make sure you understand the risks involved.