

Close Menu
binanceplan.blog
    What's Hot

    Bitcoin Burn Wallet Absorbs $8.2M as Unknown User Destroys 107 BTC in Mystery Transfer

    May 26, 2026

    Longtime Equities Bull Tom Lee Breaks Routine and Predicts Bear Market Later This Year – But Only for Certain Sectors

    May 26, 2026

    This signal shows Bitcoin is heading towards $60,000 tied to a $14 billion liquidation setup

    May 26, 2026
    Facebook X (Twitter) Instagram
    binanceplan.blog
    • Home
    • Binance
    • Cryptocurrency
      • Altcoin
      • Litecoin
      • Bitcoin
    • Crowdfunding
    • Crypto Mining
    • Ethereum
    • Fintech
    • Forex
      • Mompreneur
      • Venture Capital
    binanceplan.blog
    Home»Cryptocurrency»Why Every Bitcoin Macro Triangle Breakdown Has Led To A Retracement Phase
    Cryptocurrency

    Why Every Bitcoin Macro Triangle Breakdown Has Led To A Retracement Phase

    币安计划官方By 币安计划官方April 14, 2026No Comments3 Mins Read
    Facebook Twitter Pinterest LinkedIn Tumblr Email
    Why Every Bitcoin Macro Triangle Breakdown Has Led To A Retracement Phase
    Share
    Facebook Twitter LinkedIn Pinterest Email


    Across multiple market cycles, Bitcoin has shown a consistent technical pattern that often goes unnoticed until it’s already underway. Whenever price breaks down from a macro triangle structure, it has historically marked the beginning of a broader retracement phase rather than an immediate recovery. These large-scale consolidation formations often signal periods of compression, where price action tightens as the market prepares for a decisive move.

    How Large-Scale Consolidation Patterns Form On The Bitcoin chart

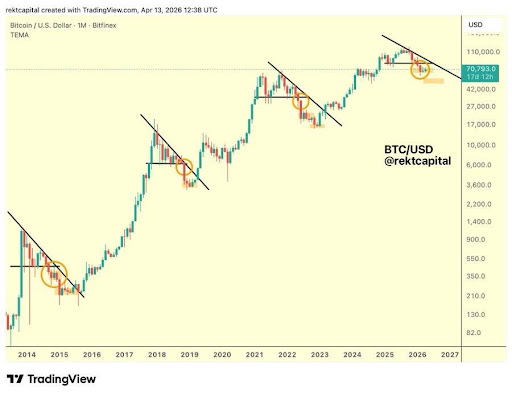
    The Bitcoin behavior is following a macro triangle breakdown that has remained structurally consistent across cycles. An analyst known as Rekt Capital on X mentioned that when BTC breaks down from its black macro triangle, price tends to retrace until it forms a bear market bottom over time.

    Related Reading

    In cycles like 2018 and 2022, the macro triangle breakdown triggered rapid bearish acceleration before transitioning into a final accumulation range at the bottom. However, the current market structure echoes the 2014 macro triangle, where price was consolidating beneath the orange macro triangle base. If BTC continues to mirror 2014, it may remain in consolidation for an extended period, with the previous triangle base at around $82,500 acting as a ceiling for price action.
    Bitcoin
    Source: Chart from Rekt Capital on X

    Rekt Capital highlighted that BTC tends to form orange boxes as major consolidation zones after breaking down from macro triangles. In 2018 and 2022, these consolidation phases developed at the bear market bottom. Meanwhile, in 2014, BTC formed two distinct consolidation ranges, one immediately after the macro triangle breakdown and another later at the ultimate bear market bottom.

    If that historical structure repeats, the current consolidation may not mark the end of the downtrend. Instead, it could be an intermediate phase, potentially preceding additional macro downside over time, with a more definitive consolidation range forming closer to the eventual bear market bottom.

    Trading Below HTF EMAs Confirms Bitcoin Trend Direction

    Bitcoin’s current structure continues to support a strongly bearish bias. According to a crypto trader known as ctm_trader on X, a high-timeframe bearish head-and-shoulders pattern is forming, and the price is rejecting at the range highs, an area where risk-to-reward clearly favors short positions.

    Related Reading

    At the same time, the majority of liquidity is sitting below the current price, while much of the upside liquidity has already been swept. The recent daily close printed a bearish doji candle. Meanwhile, the Relative Strength Index (RSI) remains in overbought territory, and the Moving Average Convergence Divergence (MACD) shows bearish momentum shifts.

    From a technical perspective, the price is trading below the high-timeframe Exponential Moving Averages (EMAs), showing that the broader trend remains bearish despite recent upward moves. On lower timeframes, BTC has already experienced a market structure shift, followed by a breakdown below recent lows.

    Furthermore, the latest rally was largely driven by news and not supported by organic price action. Historically, such impulsive moves tend to retrace. All of these combined make the downside the higher probability moves.

    Bitcoin
    BTC trading at $74,372 on the 1D chart | Source: BTCUSDT on Tradingview.com

    Featured image from Pngtree, chart from Tradingview.com


    Source link

    Share. Facebook Twitter Pinterest LinkedIn Tumblr Email

    Related Posts

    Bitcoin Burn Wallet Absorbs $8.2M as Unknown User Destroys 107 BTC in Mystery Transfer

    May 26, 2026

    Santiment Points To Possible Rebound

    May 26, 2026

    HYPE briefly overtakes Dogecoin, privacy tokens slide as US strikes on Iran rattle markets

    May 26, 2026

    XRP Price Holds ‘Best Accumulation Zone’as Whales Pull $170M From Binance

    May 26, 2026
    Add A Comment
    Leave A Reply Cancel Reply

    TOP POSTS

    Bitcoin Burn Wallet Absorbs $8.2M as Unknown User Destroys 107 BTC in Mystery Transfer

    May 26, 2026

    Longtime Equities Bull Tom Lee Breaks Routine and Predicts Bear Market Later This Year – But Only for Certain Sectors

    May 26, 2026

    This signal shows Bitcoin is heading towards $60,000 tied to a $14 billion liquidation setup

    May 26, 2026

    Trump’s Iran Pause Triggers Bitcoin Rally as Geopolitical Risk Reprices Markets

    May 26, 2026

    Subscribe to Updates

    Get the latest creative news from Binanceplan about Altcoin, Binance and Bitcoin.

    Please enable JavaScript in your browser to complete this form.
    Loading

    Welcome to BinancePlan.blog — your trusted source for learning, strategies, and insights in the world of cryptocurrency, with a strong focus on Binance and digital asset growth.At BinancePlan, our mission is simple: to make crypto easy, understandable, and profitable for everyone — whether you’re a complete beginner or an experienced trader.

    Top Insights

    Bitcoin Burn Wallet Absorbs $8.2M as Unknown User Destroys 107 BTC in Mystery Transfer

    May 26, 2026

    Longtime Equities Bull Tom Lee Breaks Routine and Predicts Bear Market Later This Year – But Only for Certain Sectors

    May 26, 2026

    This signal shows Bitcoin is heading towards $60,000 tied to a $14 billion liquidation setup

    May 26, 2026
    Get Informed

    Subscribe to Updates

    Get the latest creative news from Binanceplan about Altcoin, Binance and Bitcoin.

    Please enable JavaScript in your browser to complete this form.
    Loading
    • About Us
    • Contact Us
    • Disclaimer
    • Privacy Policy
    • Terms and Conditions
    Copyright© 2026 Binanceplan All Rights Reserved.

    Type above and press Enter to search. Press Esc to cancel.